Responsive Search Ads are the only Search ad format in Google Ads. You provide up to 15 headlines (30 characters each) and 4 descriptions (90 characters each), and Google’s AI assembles combinations in real time for each searcher. Your job isn’t to write one perfect ad — it’s to give Google a diverse, high-quality set of assets that work independently and in any combination.
This changes how ad copy works at a fundamental level. You’re not writing a single message. You’re writing a system of modular components that Google tests across thousands of combinations to find what converts. The advertisers who treat RSAs like “expanded text ads with extra slots” — writing 15 variations of the same headline — are the ones underperforming.
This guide covers how to structure your 15 headlines across distinct messaging angles, description writing that converts, pinning strategy, asset-level performance optimization, and the testing methodology that turns average ad copy into consistently high-performing campaigns.
The 30/90 Character Reality
Every copy decision happens within hard constraints: 30 characters per headline (including spaces), 90 characters per description (including spaces). Google silently truncates anything over the limit. On mobile, Google may show only one or two headlines, which means every single headline must function as a complete, compelling message on its own.
Write every headline as if it could appear alone in Position 1. Don’t write headlines that only make sense as a sequence (“The Best Way” / “To Save Money” / “Starts Here”). Google assembles combinations randomly — sequential headlines create nonsensical ads when separated.
The 15-Headline Framework: Eight Angles That Cover Everything
Most RSA underperformance comes from writing 15 variations of the same message. If your headlines all say versions of “Expert PPC Management” / “Professional PPC Services” / “Top PPC Agency,” Google is choosing between three weak variations instead of testing genuinely different messages.
Fill your 15 headline slots across these eight distinct angles:
Keyword Headlines (3 headlines)
Include your primary and secondary keywords. These establish relevance and improve Quality Score. Match the searcher’s language directly.
Examples: “Custom Window Installation” / “Residential Window Replacement” / “New Windows for Your Home”
Benefit Headlines (3 headlines)
State what the customer gets — not what you do, but what changes for them.
Examples: “Cut Energy Bills by 30%” / “Warmer Winters, Cooler Summers” / “Lower Heating Costs Year-Round”
Feature/Proof Headlines (2 headlines)
Specific, quantifiable claims about your product or service. Numbers outperform vague claims because they’re more credible and faster to process.
Examples: “Rated 4.9★ by 2,000+ Customers” / “25-Year Warranty Included”
Your company name or branded phrase. Builds recognition for searchers who see your ads repeatedly.
Examples: “WindowPro — Since 1998” / “Acme Windows & Doors”
This framework ensures Google has genuinely diverse messaging angles to test rather than minor rewrites of the same idea. Each angle serves a different persuasion function, and the AI learns which combinations convert best for each type of searcher.
Writing Descriptions That Convert
You get 4 descriptions at 90 characters each. Descriptions expand on your headlines and provide the supporting detail that turns interest into clicks.
Description 1 — your core value proposition. Explain what you offer and why it matters. Include your primary keyword naturally. “Professional window installation with lifetime warranty. Free in-home estimates — no obligation.”
Description 2 — address objections or add proof. Tackle the most common reason someone would hesitate. “Licensed & insured. Financing available. 4.9★ Google rating from 2,000+ verified reviews.”
Description 3 — highlight a specific offer or differentiator. Give a concrete reason to click now. “Spring promotion: 20% off all installations booked this month. Free energy audit included.”
Description 4 — alternative angle for different audiences. If your ad group targets multiple intent types, give Google a description that serves each. “Compare options with our online pricing calculator. No salespeople, no pressure.”
Each description must stand alone and make sense paired with any headline combination. Avoid descriptions that repeat what your headlines already say — the description’s job is to add information, not echo it.
Pinning Strategy: Control Without Killing Flexibility
Pinning locks a headline or description to a specific position. Used carefully, it ensures your most important message always appears. Used excessively, it recreates the rigid ETAs that RSAs were designed to replace.
Recommended approach:
Pin 2-3 of your strongest headlines to Position 1. This guarantees your most compelling message leads, while giving Google flexibility to test variations within that position.
Leave Positions 2 and 3 unpinned. Let Google’s AI test which combinations drive the highest click-through and conversion rates.
Don’t pin descriptions unless legally required (e.g., a mandatory disclaimer that must appear).
What happens when you over-pin: if you pin one headline to each of the three positions, you’ve essentially recreated a single static ad with no testing flexibility. Google can only show that one combination, which eliminates the learning advantage RSAs are designed to provide.
The exception: if regulatory requirements or brand guidelines mandate specific language always appear, pinning is appropriate. But even then, pin 2-3 variants to the same position rather than a single headline, so Google retains some testing room.
Ad Strength vs. Ad Rank: An Important Distinction
Ad Strength is Google’s rating (Incomplete → Poor → Average → Good → Excellent) of your RSA’s asset diversity and quantity. It evaluates whether you’ve provided enough varied headlines, included keywords, and covered different messaging angles.
Ad Strength does not affect Ad Rank. Google has confirmed this explicitly. A “Poor” rated RSA can outperform an “Excellent” rated RSA if the copy is more relevant and converts better. Ad Strength measures input breadth — how much variety you gave Google. It does not measure whether those inputs are good.
Use Ad Strength as a checklist during RSA creation (did you provide enough diverse assets?), but don’t chase “Excellent” ratings by adding filler headlines that dilute your messaging quality. Six strong, distinct headlines outperform fifteen mediocre ones, even if the latter scores higher on Ad Strength.
Asset-Level Performance: The Data That Changed Everything
Since mid-2025, Google provides click and conversion data per individual headline and description within an RSA. You can now see which specific headlines drive clicks, which drive conversions, and which are never shown.
Google rates each asset as “Best,” “Good,” “Low,” or “Learning.” The metrics that matter are conversion rate and cost per conversion per asset — not CTR in isolation. A headline with high CTR but low conversion rate is attracting clicks that don’t convert, which wastes budget.
Optimization workflow:
Check asset performance monthly after accumulating sufficient data (at least 1,000 impressions per asset).
Replace “Low” rated assets with new variations that test a different angle — not a rewrite of the same message.
Assets stuck in “Learning” after 30+ days likely aren’t getting enough impressions. Consolidate ad groups or reduce the number of assets to give each one more testing opportunity.
Run at least 2 RSAs per ad group. This gives Google more assets to test while allowing you to compare performance between RSAs.
Automatically Created Assets (ACAs): When to Trust AI
Google now generates AI headlines and descriptions automatically based on your landing page content, existing ad copy, and account data. ACAs are enabled by default in many accounts.
When ACAs help: they fill gaps in your asset pool, surface relevant messaging you hadn’t considered, and test a broader range of combinations than manual assets alone.
When to override ACAs: when they produce generic headlines that don’t differentiate you, when they include claims you can’t substantiate, or when they conflict with your brand voice. Review ACAs regularly in your asset report — don’t assume AI-generated headlines are performing well just because they’re running.
You can disable ACAs at the campaign level if you need complete control over ad messaging. But for most accounts, leaving them enabled while monitoring performance is the better approach — they expand your testing pool without additional creative effort.
Ad Extensions (Assets) That Multiply Performance
Extensions add information below your ad at no extra cost and increase your ad’s visual footprint on the results page.
Sitelinks — additional links to specific pages (pricing, features, contact, case studies). Use 4-8 sitelinks per campaign. Each sitelink should point to a genuinely different, useful page.
Structured Snippets — predefined headers (Types, Services, Brands, etc.) with a list of values. “Services: Installation, Repair, Replacement, Maintenance.” Add at least 4 values per header.
Call extensions — display your phone number. Particularly effective for service businesses where phone calls are the primary conversion action.
Location extensions — show your business address. Essential for businesses with physical locations targeting local searchers.
Price extensions — display product or service pricing directly in the ad. Useful for pre-qualifying clicks — users who see the price and still click are more likely to convert.
Extensions improve CTR by giving users more reasons and pathways to engage. They also increase your ad’s size on the results page, pushing competitors further down.
Testing Methodology
What to Test
Test one variable at a time within the RSA framework:
Headline angles — does a benefit headline outperform a social proof headline in Position 1?
Offer framing — does “20% Off” outperform “Save $50” for the same discount?
CTA language — does “Get a Free Quote” outperform “Request Pricing”?
Description approach — does an objection-handling description outperform a feature-focused one?
How to Test
Use Google Ads Experiments: duplicate your campaign, change only the RSA copy (keep keywords, bids, and audiences identical), run a 50/50 traffic split, and let it run until Google signals statistical significance. Minimum recommended volume: 10,000 impressions per month.
For faster informal testing within a single RSA, monitor asset-level performance ratings. Replace underperforming assets and measure the impact on overall RSA metrics.
Testing Cadence
Review asset performance monthly. Replace “Low” assets quarterly. Refresh all creative every 3-6 months to prevent fatigue. Even high-performing RSAs eventually decline as competitors adjust and audience behaviors shift.
Common Mistakes
Writing 15 headlines that say the same thing. “Expert PPC Management” / “Professional PPC Services” / “Top PPC Agency” gives Google three weak variations, not three distinct messages. Each headline should contribute unique information.
Ignoring character limits. Headlines over 30 characters get truncated silently. Descriptions over 90 characters get cut off. Count characters (including spaces) before submitting. AI-generated copy frequently exceeds limits — always verify.
Misaligning ad and landing page. If your headline promises “20% Off All Windows,” the landing page must show the 20% discount immediately. Mismatch kills conversion rates and damages Quality Score.
Chasing Ad Strength instead of performance. Adding filler headlines to reach “Excellent” dilutes your messaging quality. Six strong headlines outperform fifteen weak ones.
Never checking asset-level data. Weak headlines can run for months without being noticed if you only look at campaign-level metrics. Check individual asset performance monthly.
Ignoring mobile. Google may show only one headline on mobile. If your strongest message is in Position 3, mobile users may never see it. Pin your best headline(s) to Position 1.
Frequently Asked Questions
How many headlines should I write for an RSA?
Provide 8-15 headlines covering at least 5 distinct messaging angles. You don’t need to fill all 15 slots with filler — 10 strong, diverse headlines outperform 15 weak, repetitive ones. The goal is giving Google genuinely different messages to test, not hitting a number.
Should I use AI to write my Google Ads copy?
AI tools are excellent for generating first drafts, brainstorming headline variations, and producing options you might not have considered. But AI-generated copy must be reviewed for character limits (AI frequently exceeds 30/90 character constraints), factual accuracy, brand voice consistency, and differentiation from generic claims. Use AI to accelerate production, then apply human judgment to ensure quality.
Does Ad Strength affect my ad performance?
Not directly. Google has confirmed Ad Strength does not influence Ad Rank. It’s a diagnostic tool that evaluates whether you’ve provided enough diverse assets, not whether those assets are effective. Focus on conversion performance data rather than Ad Strength ratings.
When should I pin headlines in an RSA?
Pin 2-3 strong headlines to Position 1 to ensure your best message always leads. Leave Positions 2 and 3 unpinned for testing flexibility. Over-pinning (one headline per position) eliminates RSA’s core advantage. Only pin descriptions if legally required.
How often should I refresh my ad copy?
Review asset-level performance monthly. Replace “Low” performing assets as data accumulates. Refresh all creative every 3-6 months. Even winning copy eventually fatigues as competitive dynamics and audience behaviors shift. Treat ad copy as a continuous optimization loop, not a one-time setup.
What’s the single most important thing in Google Ads copy?
Relevance to the searcher’s intent. A headline that directly matches what the user is looking for — their problem, their desired outcome, their specific search query — outperforms clever wordplay, emotional triggers, and promotional offers. Match the intent first, then layer in persuasion through benefits, proof, and urgency.
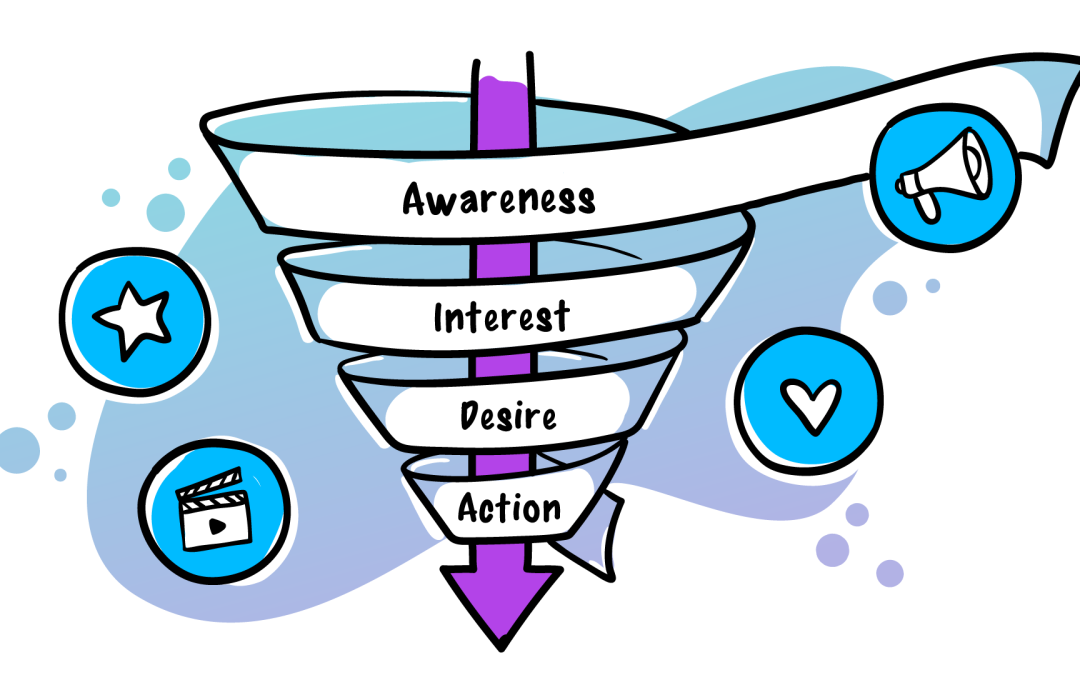
A Google Ads funnel strategy maps specific campaign types, bidding strategies, and audience targeting to each stage of the buyer’s journey — awareness, consideration, and conversion. Instead of running one campaign and hoping it serves every purpose, you build separate campaigns that meet prospects where they are and move them toward purchase through a deliberate sequence.
The case for this approach is well-documented. Nielsen’s meta-analysis of CPG campaigns found that full-funnel strategies deliver up to 45% higher ROI than single-stage campaigns. Brands that added upper or lower-funnel campaigns to their existing mid-funnel tactics saw 52% more incremental sales. The performance gap between funnel-aligned accounts and single-campaign accounts compounds over time.
This guide covers the campaign types that work at each funnel stage, the audience targeting that connects one stage to the next, budget allocation across stages, bidding strategies by objective, and the measurement framework that proves whether each stage is doing its job.
The Funnel Structure at a Glance
Stage
Objective
Campaign Types
Primary KPIs
Audience
Budget %
TOFU (Awareness)
Reach new prospects
Video Reach, Display, Demand Gen
Impressions, reach, CPM, view rate
Cold: demographics, affinity, similar
20-30%
MOFU (Consideration)
Build interest and trust
Search (non-brand), Demand Gen, Video View, Shopping
CTR, engagement, CPC, content downloads
Warm: in-market, custom segments, site visitors
30-40%
BOFU (Conversion)
Convert high-intent prospects
Search (high-intent), Shopping, PMax, RLSA
Conversions, CPA, ROAS, revenue
Hot: remarketing, cart abandoners, Customer Match
30-40%
Retention
Maximize lifetime value
RLSA, Customer Match, Display remarketing
Repeat purchase rate, LTV, ROAS
Existing customers: CRM lists, past purchasers
10-15%
These percentages are starting points. New brands with no audience should weight TOFU higher (up to 40%). Established brands with large remarketing pools should weight BOFU and Retention higher.
Top of Funnel: Awareness Campaigns
The Goal
Introduce your brand to people who don’t know you yet. TOFU isn’t about conversions — it’s about building the audience pool that feeds your lower-funnel campaigns. Every remarketing list, every branded search query, every repeat visit begins with a TOFU touchpoint.
Campaign Types
Video Reach Campaigns — maximize unique reach across YouTube inventory (skippable in-stream, non-skippable, bumper ads, Shorts). Google’s AI distributes your budget across formats for the lowest cost per unique reach. YouTube is the single most effective TOFU format on Google Ads — 75% of users say YouTube advertising makes them more aware of new brands.
Display Campaigns — visual ads across Google’s Display Network (2+ million websites and apps, reaching 90%+ of internet users). Lower engagement than video but broader reach at very low CPMs.
Demand Gen (awareness use case) — image and video ads across YouTube, Gmail, and Discover feeds. Demand Gen’s visual-first format performs well for brand introduction content. Use the awareness objective to maximize reach rather than conversions.
Targeting
Cast a wide net. TOFU targeting should be broad enough to build a meaningful audience:
Demographics (age, gender, location)
Affinity audiences (long-term interests and habits)
Similar/lookalike audiences based on your existing customers
Topic targeting (reach users consuming content related to your category)
Avoid stacking too many targeting layers at TOFU — over-narrowing your audience at the awareness stage defeats the purpose. Aim for audience sizes of at least 500,000 to give the algorithm room to optimize.
Creative
Educate and introduce. Don’t sell. TOFU creative should highlight the problem you solve, introduce your brand identity, and create enough curiosity that viewers remember you when they encounter your brand again. Keep videos under 15-30 seconds. Lead with a hook in the first three seconds. Include your brand name and logo early so that even viewers who skip still register your brand.
Bidding
CPM (cost per thousand impressions) or Target CPM for Display and Video. Max Clicks if running Search campaigns for broad educational keywords. The goal is maximum exposure at the lowest cost per impression, not conversions.
The TOFU-to-MOFU Handoff
Every TOFU campaign should feed a remarketing list. Create audience segments for YouTube viewers (watched 25%, 50%, 75%, or 100% of your video), Display ad clickers, and website visitors from TOFU landing pages. These segments become your MOFU targeting pool. Without this handoff, your TOFU spend is disconnected from your conversion campaigns.
Middle of Funnel: Consideration Campaigns
The Goal
Deepen engagement with people who know your brand but haven’t converted. MOFU prospects have a problem, know solutions exist, and are evaluating options. Your job is to build preference for your solution over alternatives.
Campaign Types
Search Campaigns (non-brand, commercial intent) — target keywords where users are researching solutions. “Best project management software for remote teams,” “CRM comparison for small business,” “[competitor] alternatives.” These queries signal active evaluation, not purchase readiness.
Demand Gen Campaigns (engagement use case) — image and video ads across YouTube, Shorts, Gmail, and Discover that target warmer audiences. Demand Gen replaced Discovery campaigns and delivers engaging visual content to users who’ve shown interest signals.
Video View Campaigns — optimize for cost-per-view (users who watch 30+ seconds). Use for product demos, customer testimonials, and explainer videos that build understanding and trust. Pair with remarketing audiences from your TOFU campaigns.
Shopping Campaigns (browsing intent) — Shopping ads let users compare products visually before clicking. Users see images, prices, and store names. This visual comparison stage naturally fits MOFU because users are evaluating options rather than completing purchases.
Targeting
Shift from broad to warm:
In-market audiences — users Google has identified as actively researching products in your category
Custom segments — built from keywords describing purchase intentions, URLs of competitor websites, and apps your prospects use
TOFU remarketing audiences — website visitors, video viewers, and ad engagers from your awareness campaigns
Similar audiences based on your converter profiles
Creative
Show proof. MOFU creative should demonstrate why your solution is the right choice. Product demos, customer testimonials, case studies, feature comparisons, and educational content that positions your expertise. Address common objections and differentiate from competitors.
Ad copy should build credibility: include seller ratings (requires 100+ reviews), specific results (“45% faster onboarding”), and trust signals (certifications, client logos, award badges).
Bidding
Maximize Clicks or Manual CPC for Search campaigns where you want traffic to consideration content. Target CPA if you’re optimizing for lead magnet conversions (content downloads, webinar signups). CPV (cost-per-view) for Video View campaigns.
The MOFU-to-BOFU Handoff
Create remarketing segments from MOFU engagement: users who visited product pages, watched product demos past 50%, downloaded lead magnets, visited pricing pages, or added items to cart. These high-intent behaviors define your BOFU audience. The more granular your MOFU segmentation, the more precisely you can target and message at BOFU.
Bottom of Funnel: Conversion Campaigns
The Goal
Convert high-intent prospects into customers. BOFU targets people who know your brand, understand your solution, and are close to making a decision. Every element — keywords, creative, landing pages, bidding — should focus on removing the last barrier to purchase.
Campaign Types
Search Campaigns (high-intent keywords) — target transactional queries containing “buy,” “order,” “pricing,” “demo,” “free trial,” specific product names, and brand terms. Use exact match and phrase match for maximum relevance. These are your highest-converting, highest-value keywords.
Performance Max — runs across all Google networks (Search, Shopping, YouTube, Display, Gmail, Discover, Maps) from a single campaign. PMax works best at BOFU when it has strong conversion data to optimize from, quality creative assets, and audience signals (your remarketing lists and Customer Match data) guiding its targeting. PMax is the natural BOFU campaign type for ecommerce businesses with product catalogs.
Shopping Campaigns (purchase intent) — when paired with high-intent queries and competitive pricing, Shopping ads drive direct purchases. Standard Shopping gives you more control; PMax gives you broader reach with AI optimization.
RLSA (Remarketing Lists for Search Ads) — adjust bids or show different ads when people on your remarketing lists search for your keywords. RLSA users convert at significantly higher rates than cold searchers. Bid 40-70% higher for cart abandoners and pricing page visitors.
Display/Video Remarketing — show ads to high-intent audiences (cart abandoners, product page viewers) across the Display Network and YouTube. Dynamic remarketing shows users the specific products they viewed.
Targeting
Hot audiences only:
Cart abandoners (visited checkout but didn’t complete)
Pricing/demo page visitors
Product page viewers who spent significant time
Customer Match lists (CRM contacts who haven’t converted)
High-intent search queries with transactional modifiers
Creative
Create urgency and remove friction. BOFU ad copy should include specific offers (discounts, free shipping, free trial), urgency signals (“Offer ends Friday,” Google’s countdown ad customizer), social proof (star ratings, review counts, customer testimonials), and clear CTAs (“Start Your Free Trial,” “Get 20% Off Today”).
Landing pages should match the ad promise exactly, have a single clear CTA, remove navigation and competing links, include trust signals (security badges, money-back guarantee), and load in under 2.5 seconds on mobile.
Bidding
Conversion-focused bidding exclusively. Target CPA, Target ROAS, Maximize Conversions, or Maximize Conversion Value. These Smart Bidding strategies use machine learning to optimize for conversions in every auction based on device, location, time, and user signals. Set targets based on actual achieved performance, not aspirational goals.
Retention: Post-Purchase Campaigns
The Goal
Maximize customer lifetime value through repeat purchases, upsells, cross-sells, and loyalty. Returning customers spend 67% more than first-time buyers and convert at rates above 50% when they’ve made two or more prior purchases.
Campaign Types
Customer Match — upload your customer email list and target past buyers across Google’s ecosystem when they search for related products. A customer who bought running shoes six months ago and now searches for “running socks” is a high-probability conversion.
RLSA for past buyers — bid higher when previous customers search for products in your catalog. Show ad copy that acknowledges their existing relationship: “Welcome back — 15% loyalty discount.”
Display/Video Remarketing — target past purchasers with cross-sell and upsell messaging. For consumable products, time your remarketing to coincide with typical replenishment cycles (if your product lasts 60 days, start remarketing at day 40).
Targeting
Existing customers only, segmented by purchase recency, frequency, and value (RFM):
Recent buyers (last 30 days) — cross-sell related products
Lapsed buyers (90-180 days) — win-back offers
High-value buyers — VIP offers, early access, loyalty incentives
Product-specific segments — target complementary products based on what they bought
Budget Allocation
Allocate 10-15% of total Google Ads budget to retention. The cost per conversion from existing customers is dramatically lower than from new prospects, so this allocation produces outsized returns relative to spend.
Connecting the Stages: The Audience Flow
The funnel only works if audiences flow between stages. Without deliberate audience handoffs, each campaign operates in isolation.
TOFU → MOFU: Build remarketing lists from every TOFU campaign. YouTube viewers who watched 50%+, Display ad clickers, and website visitors from awareness landing pages all enter your MOFU targeting pool. Set up these audiences before launching TOFU campaigns — you want the data collection running from day one.
MOFU → BOFU: Segment MOFU engagers by intent signals. Product page viewers, pricing page visitors, lead magnet converters, and video viewers who watched demos past 50% move into BOFU remarketing lists. Cart abandoners get their own dedicated segment with the highest bid adjustments.
BOFU → Retention: Every converter enters a Customer Match or remarketing list that feeds your retention campaigns. Exclude recent converters from your BOFU prospecting campaigns (they already bought — you don’t need to pay to reach them again).
This audience flow creates a self-reinforcing system: TOFU builds the audience, MOFU qualifies it, BOFU converts it, and Retention maximizes its value. Each stage feeds the next.
Measurement by Funnel Stage
Each stage has different success metrics. Measuring TOFU by conversion rate or BOFU by impressions produces misleading conclusions.
TOFU metrics: impressions, unique reach, frequency, CPM, video view rate, brand search lift (did branded searches increase after TOFU campaigns launched?), remarketing list growth rate.
MOFU metrics: click-through rate, cost per click, engagement rate, content download/lead conversion rate, time on site from MOFU traffic, remarketing list growth from MOFU to BOFU audiences.
BOFU metrics: conversion rate, cost per acquisition, ROAS, revenue, cart abandonment recovery rate, RLSA performance vs standard search.
Retention metrics: repeat purchase rate, customer lifetime value, cross-sell/upsell conversion rate, ROAS from Customer Match campaigns.
Track these in Google Analytics 4 using funnel exploration reports. Connect Google Ads to GA4 for cross-campaign attribution. Use data-driven attribution (rather than last-click) to understand how TOFU and MOFU campaigns contribute to BOFU conversions — last-click attribution systematically undervalues upper-funnel campaigns.
Frequently Asked Questions
How much budget should I allocate to each funnel stage?
Start with 20-30% TOFU, 30-40% MOFU, 30-40% BOFU, and 10-15% Retention. Adjust based on your business stage: new brands should weight TOFU higher (up to 40%) to build audience. Established brands with large remarketing pools can weight BOFU and Retention higher. Review allocation quarterly based on where conversions are most efficient and where remarketing lists need replenishing.
Can I skip the top of funnel and only run conversion campaigns?
You can, but your results will plateau. BOFU campaigns target people who already know your brand — once you’ve converted the available high-intent audience, there’s no one left to convert. Without TOFU campaigns feeding new prospects into your remarketing lists, your BOFU audience pool shrinks over time. TOFU campaigns don’t produce immediate conversions, but they produce the audiences that BOFU campaigns convert.
Where does Performance Max fit in the funnel?
PMax operates across the entire funnel but works best as a BOFU or full-funnel campaign. It runs on all Google networks simultaneously and uses AI to find converting users wherever they are. For ecommerce with product catalogs, PMax is the primary BOFU campaign type. Add your remarketing lists and Customer Match data as audience signals to guide PMax toward your warmest prospects. Monitor PMax’s channel performance breakdown to ensure it’s spending on conversion-friendly surfaces rather than leaking budget into Display impressions.
How do I know if my TOFU campaigns are working if they don’t produce conversions?
Track TOFU success through leading indicators: remarketing list growth rate (are you adding enough people to your MOFU/BOFU pools?), brand search volume (did branded searches increase after launching TOFU?), and assisted conversions in GA4 (do TOFU touchpoints appear in the conversion paths of people who ultimately purchase?). Data-driven attribution in GA4 assigns fractional credit to upper-funnel touchpoints, showing their contribution even when the last click happens through a BOFU campaign.
How long should I run a funnel strategy before evaluating results?
Allow at least 8-12 weeks for a full-funnel strategy to produce measurable results. TOFU campaigns need time to build remarketing pools. MOFU campaigns need those pools to reach meaningful size. BOFU campaigns need conversion data for Smart Bidding to optimize effectively. Evaluating a funnel strategy after two weeks will lead you to kill upper-funnel campaigns that haven’t had time to feed the lower funnel — which is the most common mistake advertisers make with funnel strategies.
HARO shut down in December 2024. Then it came back under new ownership. Then the name changed again. If you searched for “HARO link building” recently and found conflicting information, you’re not alone—the platform went through three brand names in eighteen months.
Here’s what matters: the tactic still works. Responding to journalist queries remains one of the highest-ROI link building channels available. You pitch reporters who already need expert sources, and when they use your quote, you earn an editorial backlink from a publication you’d never get through cold outreach.
But the landscape in 2026 looks different from a few years ago. HARO is no longer the only game. Anti-spam filters now catch AI-generated pitches. And the value of these placements goes beyond traditional SEO—editorial mentions in trusted publications increasingly influence how AI search engines like ChatGPT, Perplexity, and Google AI Overviews decide which brands to cite.
This guide covers how HARO works today, how to set up across multiple journalist query platforms, how to write pitches that actually get selected, and how to turn placements into measurable SEO results.
What HARO Link Building Actually Is
HARO stands for Help a Reporter Out. The concept is simple: journalists post questions when they need expert input for articles they’re writing. You register as a source, respond to relevant queries with your expertise, and if a journalist picks your response, they quote you in their article and typically link back to your website.
These backlinks carry serious weight because they’re editorial. You didn’t pay for the placement, stuff a link into an existing article, or publish a guest post on a low-quality blog. A journalist independently chose your expertise to strengthen their story, and the link is part of that citation.
A typical workflow:
A journalist posts a request for expert commentary.
You find a query that matches your expertise.
You send a concise, useful response before the deadline.
The journalist selects your quote.
Your brand gets mentioned in the published article with a backlink.
The best HARO links come from relevance, not volume. A single placement in a respected industry publication can move the needle more than dozens of weak links from irrelevant sites.
The HARO Timeline: What Changed From 2024 to 2026
Most guides online are outdated. Here’s the documented sequence of events:
2008: Peter Shankman founds HARO as a simple email service connecting journalists with sources.
2014: Cision acquires HARO through the Vocus merger.
2023: Cision renames HARO to “Connectively” and introduces paid tiers. The community pushes back hard.
December 9, 2024: Cision permanently shuts down Connectively. Thousands of SEO professionals lose their primary link building channel overnight.
April 15, 2025: Featured.com (led by CEO Brett Farmiloe) acquires HARO from Cision and relaunches it as a free, ad-supported platform six days later.
2026: Featured.com also revives the Connectively name as its platform product. HARO now operates as the free email digest, while Connectively serves as the platform-based experience with filtering and response tracking.
In parallel, Peter Shankman—HARO’s original founder—launched Source of Sources (SOS) in response to the shutdown, offering a more curated, invite-based alternative.
What this means for you right now:
Your old HARO account doesn’t carry over. Create a new one at helpareporter.com.
HARO is free. The email digest format is back—three emails per day.
The revived platform actively screens for AI-generated pitches and spam. Accounts that submit AI-generated content risk getting banned.
HARO alone isn’t enough for consistent results in 2026. The serious practitioners run two to three platforms simultaneously.
Why HARO Backlinks Still Matter—and Why They Matter More Now
Editorial links are hard to fake
When a journalist selects your quote for their article, that’s an independent editorial endorsement. These links are harder to manufacture, harder to manipulate, and carry more trust signal than most link types you can acquire through outreach.
They strengthen E-E-A-T signals
Getting quoted as a named expert on trusted publications directly supports Experience, Expertise, Authoritativeness, and Trustworthiness—the quality factors Google’s systems evaluate. A quote attributed to a real person with real credentials, published by a real editorial team, is one of the strongest E-E-A-T signals you can earn.
They feed AI search visibility
This is the newer reason to pay attention—and it’s significant.
AI answer engines like ChatGPT, Perplexity, and Google AI Overviews build their responses by synthesizing content from across the web. Publications with real editorial standards are over-represented in those citations compared to brand-owned content, press releases, or low-quality blogs.
An Ahrefs study analyzing 75,000 brands found that brand web mentions correlate with Google AI Overview appearances at 0.664—roughly three times stronger than the correlation with backlink count (0.218). That means even unlinked brand citations from credible publications meaningfully strengthen your visibility in AI-generated answers.
Every placement in a qualified publication creates an indexed, third-party association between your name, your company, and the topic—in a source that AI engines treat as credible. Brands earning editorial mentions now are building the foundation for AI search visibility before most competitors even understand how it works.
They diversify your link profile
A healthy link profile includes different types: editorial mentions, guest posts, niche edits, resource links, digital PR placements. HARO adds the editorial and PR layer that’s hard to replicate through other channels.
They open journalist relationships
A successful HARO response can turn into a long-term source relationship. If you consistently provide useful insights, journalists may come back to you for future stories—without you needing to pitch.
HARO vs. Digital PR vs. Guest Posting: Know the Difference
StrategyHow it worksBest forMain limitationHARO / journalist queriesRespond to journalist requests with expert quotesEditorial links, brand mentions, E-E-A-T signalsCompetitive, deadline-driven, reactiveDigital PRCreate newsworthy campaigns, data studies, or expert commentary and pitch them proactivelyLarge-scale media coverage and brand authorityRequires stronger ideation and outreach resourcesGuest postingPublish contributed articles on relevant websitesControlled anchor text, topical linksQuality varies widely; many sites charge for posts
HARO is reactive—you respond to existing demand. Digital PR is proactive—you create the story. Guest posting gives you content control. The strongest link building programs combine all three.
Where to Pitch in 2026: The Platform Landscape
HARO is no longer the only platform worth your time. Here’s how the current ecosystem breaks down:
PlatformBest forVolumeFree tierKey detailHARO (via Featured.com)General volume, broad reachHighYes (free email digest)Classic 3x daily emails; AI spam detection activeQwotedPremium, high-DR publicationsMediumYes (2 pitches/month, delayed access)Journalist verification required; ~70% of queries from DR 70-100 sitesSource of Sources (SOS)Curated, high-trust queriesLowerFree (invite-based)Built by HARO’s original founder; highest dofollow rate among platformsMentionMatchB2B SaaS sourcesMediumYesFormerly Help a B2B Writer; strong B2B query filteringSourceBottleAU/NZ and lifestyle marketsMediumYesBest coverage for Australian and New Zealand publicationsResponseSourceUK marketMediumPaidUK-focused publisher base
Recommended starting stack: Sign up for HARO (free) for volume, add Qwoted once you’ve refined your pitch structure, and join Source of Sources for high-quality queries with less competition. If you’re in B2B, add MentionMatch. If you’re targeting UK media, add ResponseSource.
The most common mistake in 2026 is picking just one platform and treating these as competitors. They’re different fishing spots. A combination of two or three gives you enough daily query volume to maintain consistency without burning out on irrelevant pitches.
Step 1: Set Up Your Source Profiles
Before pitching, every platform asks you to create a source profile. Journalists use these profiles to filter and evaluate sources, so a weak profile can disqualify you before your pitch gets read.
What to include:
Name and title. Be specific. “Founder at Acme” is weaker than “CEO at Acme, 8 years in B2B SaaS growth.”
Areas of expertise. These determine which query categories you receive. Keep them tightly focused on what you actually know—pitching outside your listed expertise is the fastest way to get filtered out.
Professional bio. Two to three sentences maximum. Lead with your credibility on the topic, not a company description.
Website URL. This is where the backlink will point.
Headshot. Have a LinkedIn-style headshot (300x300px minimum) hosted as a shareable link on Google Drive or Dropbox—not as an email attachment.
Platform-specific setup notes:
HARO: Sign up at helpareporter.com. Select your industry categories in the Preferences section. You’ll receive three daily emails—morning, afternoon, and evening editions.
Qwoted: Requires profile verification. The free tier gives you two pitches per month with a delay on new queries. The Pro plan ($99/month annually) removes the delay and unlocks unlimited pitches.
Source of Sources: Invite-based. Join the waitlist. Once approved, pitch off-topic and you’re banned—it runs on an honor system.
Step 2: Set Up Your Query Filtering System
HARO alone sends three emails per day, and if you’re on multiple platforms, the volume adds up fast. Without a system, you’ll either miss good opportunities or waste time reading irrelevant queries.
Gmail filter setup for HARO:
Go to Gmail Settings and click “Filters and Blocked Addresses.”
Click “Create a new filter.”
In the “From” field, enter the sender address for your HARO digest emails.
Click “Create filter” and choose actions: “Skip the Inbox,” “Apply the label” (create a label like “HARO Queries”).
Set up a second filter using the “Has the words” field with keywords from your niche (e.g., “SEO,” “backlinks,” “SaaS pricing,” “ecommerce”) to auto-star or separate relevant queries.
Additional monitoring tools:
Google Alerts for your name and company name—this catches published placements without you checking manually.
The #journorequest hashtag on X/Twitter. Journalists post source requests directly here, often with tight deadlines. Set up a keyword column in your preferred social media dashboard.
Daily time commitment: Budget 20 to 30 minutes per day for scanning queries, filtering for relevance, and writing responses. Batch your scanning to two fixed time blocks: once in the morning after the first HARO digest arrives, and once in the early afternoon. Trying to respond to everything in real-time burns more time than it’s worth.
Step 3: Identify High-Value Queries
Not every query deserves a response. The practitioners who earn consistent placements are selective—they pitch fewer queries with higher relevance, rather than spraying generic responses everywhere.
Before responding to any query, run through this filter:
Does the topic directly match my expertise? If you’d need to Google the answer, skip it.
Can I provide a response based on firsthand experience—not just general knowledge?
Is the publication relevant to my audience or niche?
Is the deadline realistic? Most journalist deadlines are 24 to 48 hours. If you can’t respond within a few hours of the query posting, the window is likely closed.
Does the publication typically include backlinks, or do they only give unlinked mentions?
DR 40-59: Solid SEO value. Good for building link profile breadth.
DR 60-79: Strong editorial placements. These move rankings.
DR 80+: Premium. These are the placements that reshape your authority profile.
That said, relevance matters more than raw DR. A DR 50 publication that perfectly matches your niche often delivers better SEO results than a DR 85 site with zero topical overlap.
One thing to watch for: Some high-DR publications only give nofollow links or unlinked mentions. That’s still valuable for brand visibility and E-E-A-T—but know what you’re getting before you invest time in a detailed response.
Anonymous queries: Some platforms let journalists post anonymously. Experienced practitioners often skip these because there’s no way to assess publication quality upfront. If you do respond to anonymous queries, keep your pitch short to minimize time investment.
Step 4: Write a Pitch That Gets Selected
This is where most HARO campaigns succeed or fail. Journalists receive dozens—sometimes hundreds—of responses per query. The average response rate tells the story:
Pitch typeTypical placement rateGeneric template (name, title, vague offer to help)~3%Personalized but no specific evidence of experience~8-12%Data-backed or experience-specific~18%Responded within 1 hour of query publication~20%
The pattern is clear: specificity and speed are the two biggest levers.
Keep it simple and scannable. The journalist is skimming a long inbox.
Opening line: State the specific credential that makes you the right source for this query. Not your company description—your relevant experience.
Core response (150-200 words): Answer the journalist’s question directly. Give them a usable quote in the first two to three sentences. Add one concrete proof element—a number, a specific outcome, a finding from your own work. This is what separates your pitch from the AI-generated responses flooding every query.
Short bio (2-3 sentences): Name, title, company, and one line on what you do. Keep it factual.
Contact info: Website URL, LinkedIn profile.
Good Pitch vs. Bad Pitch
Weak pitch:
“Backlinks are very important for SEO. Businesses should build high-quality backlinks because they help increase rankings and traffic. HARO is a good way to get backlinks from authority websites. I’d be happy to provide additional commentary.”
This says nothing a journalist can quote. It’s a definition, not an insight.
Strong pitch:
“The biggest mistake we see with HARO is treating it like a link acquisition tool instead of a journalist relationship channel. Reporters aren’t looking for SEO pitches—they’re looking for a source that makes their article better. We tracked 200 of our HARO responses over six months and found that pitches with a specific number or personal finding got placed at 3x the rate of pitches with general advice. The responses that win aren’t the longest—they’re the ones where the journalist can highlight a sentence and paste it directly into their draft.”
This has a point of view, includes a specific data point, and gives the journalist a sentence they can use as-is.
What Gets Your Pitch Rejected Immediately
Opening with a company description instead of answering the question
Vague offers like “I’d be happy to comment” or “feel free to reach out”
Pitches longer than 300 words
Content that reads as AI-generated (platforms are actively filtering for this in 2026)
Responding to queries outside your listed expertise
Including three or more links in the pitch body—one supporting link is fine; more than that reads as spam
Ignoring the query’s specific instructions (word count, format, credential requirements)
The AI Pitch Warning
This deserves its own callout because it’s a 2026 reality that didn’t exist before. The relaunched HARO actively screens for AI-generated content using AI text detection, LinkedIn profile verification, image analysis (to catch fake headshots), and community reporting.
Featured.com’s founder has been direct about the policy: if you’re not genuinely helping a reporter out, you get banned. The old platform died partly because AI-generated spam overwhelmed journalists to the point where they stopped trusting the responses.
Use AI to check your grammar or organize your thoughts if you want. But the insight itself—the specific finding, the example from your work, the opinion you’re staking—needs to come from actual experience. That’s the entire product you’re offering as a source.
Step 5: Follow Up and Handle Responses
Most journalists won’t notify you when your quote goes live. You need to monitor for placements proactively.
When your pitch is used:
Verify the link. Visit the published article, find your quote, and confirm the backlink is live and pointing to the correct URL.
Check the link type. Is it dofollow or nofollow? Both have value, but dofollow links pass direct SEO authority.
Thank the journalist. A short, non-promotional thank-you note goes a long way. Share the article on your social channels if appropriate. This builds the relationship for future queries.
If the link is missing: Some journalists use your quote but don’t include a link. A polite follow-up asking if they’d be willing to add a link to your company name is appropriate. Keep it brief and respectful—don’t frame it as a demand.
When your pitch isn’t selected:
Move on. Don’t send follow-up emails asking if they saw your response. If the journalist hasn’t responded, they’ve already selected their sources or the article has been filed.
The one exception: if the deadline hasn’t passed and you have additional information that genuinely adds to what you already submitted (new data, a relevant development), a brief follow-up offering the additional context is acceptable. Keep it to one follow-up maximum.
Step 6: Track Results and Optimize Your System
HARO link building becomes a repeatable system when you track what works and what doesn’t. Without tracking, you’re guessing.
Build a tracking spreadsheet with these columns:
Date of query
Platform (HARO, Qwoted, SOS, etc.)
Journalist name
Publication name
Topic
Deadline
Expert used (if you have multiple team members pitching)
Response sent (yes/no)
Pitch angle (one-line summary)
Status (pending / placed / not selected)
Published URL
Link type (dofollow / nofollow / unlinked mention)
Domain Rating of the publication
Referral traffic (check Google Analytics)
Benchmarks to track monthly:
Pitch-to-placement rate. The target range for consistent practitioners is 5-15%. Below 5% means your pitches need work. Above 15% means you’re performing well.
Monthly link count. A consistent effort of 20 to 40 pitches per month typically produces 1 to 3 placements.
Average DR of placements. Track whether you’re landing on sites that match your target quality range.
Referral traffic from placements. This shows up in Google Analytics within days of publication and signals whether the placement is generating real reader engagement.
Review cadence: Wait about three months, then analyze your data for patterns. Which topics earn the highest acceptance rates? Which platforms produce the most placements in your niche? Which pitch formats get positive results? Use those patterns to double down on what works and stop investing time in what doesn’t.
Scaling Beyond HARO: Building a Multi-Channel System
HARO is one channel in what should be a broader journalist query and digital PR strategy. Here’s how the pieces fit together:
Reactive PR
When a significant event happens in your industry, journalists covering the story need expert sources fast. The window is 4 to 24 hours. Monitor Google Trends for rising topics, watch the #journorequest hashtag on X, and set up Google Alerts for your core industry terms.
A reactive pitch follows the same structure as a HARO pitch, but the hook is the current event: “I saw you’re covering X—here’s what we’ve observed from our side that might be useful for your piece.”
Reactive PR can produce links from DR 80+ publications within hours when timed well. It’s harder to systematize than platform-based pitching, but the link quality often exceeds what journalist query platforms produce.
Unlinked Brand Mention Outreach
Every time someone writes about your product, your company, or your people without linking to you, that’s a low-friction link opportunity. The site already trusts your brand enough to mention it. A short email asking if they’d be willing to add a link converts at a significantly higher rate than cold outreach to a stranger.
Set up Google Alerts for your brand name, your founder’s name, and your key product names. When you spot an unlinked mention, send a brief, polite email requesting the link.
Complement with Guest Posting and Digital PR
HARO is reactive—you respond to existing demand. Guest posting and digital PR are proactive—you create the content and pitch it. The strongest link profiles combine both approaches:
HARO and journalist queries for editorial mentions and E-E-A-T signals
Guest posting for controlled anchor text and topical relevance
Digital PR campaigns for large-scale coverage from newsworthy data or stories
Realistic Timeline: When to Expect Results
HARO link building is not instant. Here’s a realistic progression:
Weeks 2-4: Send your first 15 to 20 pitches. Experiment with different angles and response lengths. Expect zero to one placement.
Month 2: Refine your pitch structure based on early feedback. Identify which query types match your expertise best. Possible first placements start appearing.
Month 3-6: Pattern recognition kicks in. You know which platforms, topics, and pitch formats work for your niche. Consistent effort of 20 to 40 pitches per month produces 1 to 3 placements.
Month 6+: Compounding effect. Eight to fifteen quality editorial links accumulated over six months is where the SEO impact becomes measurable. Some of these placements will start earning referral traffic and contributing to ranking improvements.
Industry data puts initial measurable results for roughly 85% of campaigns within the 3 to 6 month window. Don’t expect week-one ranking changes from a single placement—the value compounds over time.
Common Mistakes That Kill Your HARO Results
Pitching every query you see. Quality over quantity. Five highly relevant pitches outperform fifty generic ones.
Writing pitches that sound like press releases. Journalists want quotable expertise, not promotional copy. Focus on teaching, not selling.
Using AI to generate your entire pitch. Platforms actively detect this. And even if the filters miss it, journalists can tell. The writing pattern, the hedged opinions, the generic structure—it all signals “not a real expert.”
Ignoring publication quality. Chasing every opportunity regardless of the site’s authority or relevance wastes your time and dilutes your efforts.
Not tracking results. Without data, you can’t identify what works. Set up the spreadsheet and review it monthly.
Treating HARO as your only link building channel. Journalist queries are one piece. Combine them with guest posting, digital PR, and unlinked mention outreach for a well-rounded link profile.
Expecting overnight results. HARO is a consistency play. The people who earn 3 to 5 links per month aren’t spending more time than those who earn zero—they’re spending it more deliberately.
Frequently Asked Questions
Is HARO still free in 2026?
Yes. Featured.com relaunched HARO in April 2025 as a free, ad-supported email digest. You can sign up at helpareporter.com at no cost. Featured.com also operates Connectively as a platform product with paid tiers for additional features like filtering and response tracking. Other platforms like Qwoted offer free tiers with limited pitches and paid plans for full access.
Can I use AI to write my HARO pitches?
AI can help you structure your thoughts or check grammar, but the final pitch needs to read like it came from someone who has actually done the work. HARO, Qwoted, and Featured.com all deploy AI content detection. Accounts that consistently submit AI-generated pitches get flagged or banned. The elements that win placements—a specific data point, a personal finding, a concrete example—are exactly what you need to provide yourself.
How many queries should I respond to per week?
Start with three to five highly relevant queries per week. Track your placement rate, and adjust. Responding to 20 generic queries will produce worse results than five targeted pitches backed by genuine expertise. Scale once you’ve identified which query types and platforms work best for your niche.
Does every HARO placement include a backlink?
No. Some journalists quote you without linking. Some mention your company name without any link. Some give nofollow links. All of these still have value—brand mentions in credible publications support E-E-A-T and AI search visibility even without a dofollow backlink. But you should track link type for each placement so you know your actual link acquisition rate.
What’s a realistic pitch-to-placement rate?
Expect 5 to 15%, depending on your niche, platform, and pitch quality. Data from VisibilityStack tracking 143 placements from over 1,000 pitches showed roughly a 14% overall rate. Featured.com produced the highest approval rate in their data at 18 to 20%. If you’re starting out, expect 5 to 8% until you’ve refined your approach.
Do HARO backlinks help with AI search visibility?
Yes—and this is an increasingly important reason to pursue them. Ahrefs found that brand web mentions correlate with Google AI Overview appearances at 0.664, far outperforming the correlation with backlink count alone (0.218). Publications with real editorial standards are disproportionately cited by ChatGPT, Perplexity, and Google AI Overviews. Every editorial placement increases the probability your brand appears in AI-generated answers.
Should I do HARO myself or hire an agency?
Do it yourself if you have genuine subject-matter expertise, can commit 20 to 30 minutes daily, and respond within hours of a query posting. Hire an agency if your team lacks time for daily monitoring, you want a repeatable system across multiple platforms, or you need HARO integrated into a broader link building and digital PR program. The main challenge with DIY isn’t skill—it’s consistency.
What’s the difference between HARO and Source of Sources?
Source of Sources (SOS) was created by Peter Shankman, the same person who founded HARO in 2008. SOS runs on an invite-based, honor-system model: pitch off-topic and you’re banned. It has lower volume than HARO but the highest dofollow rate and the best signal-to-noise ratio among current platforms. HARO (under Featured.com) has broader reach and higher volume but also more competition per query.
Meta is projected to overtake Google in global ad revenue for the first time in 2026 — $243.46 billion versus $239.54 billion. That shift tells you where advertiser budgets are moving. It doesn’t tell you which platform is right for your business. That requires a different analysis entirely.
Google Ads captures existing demand. When someone searches “emergency plumber near me” or “best CRM for startups,” they’ve already identified a need. Google puts your ad in front of them at that exact moment. This is demand capture.
Meta Ads creates new demand. When someone scrolls Instagram and sees your product ad, they weren’t looking for it. They didn’t have a specific need in mind when they opened the app. Meta Ads surfaces or creates the desire. This is demand creation.
Neither approach is universally better. They work on different parts of the same buyer journey. The question is which part matters most for your business right now, and how to use both together when you’re ready to scale.
What Changed on Each Platform in 2025-2026
Before comparing features, the recent platform changes matter because they affect how each system actually works today.
Meta’s Andromeda update restructured the ad ranking model to weight creative quality as an explicit bid modifier. Accounts running high-quality, high-engagement creative are seeing lower effective CPMs. Accounts running mediocre creative at high budgets are seeing efficiency erosion. Creative quality is no longer just a nice-to-have on Meta — it’s a cost lever.
Meta removed detailed targeting exclusions in March 2025. You can no longer target an interest while excluding another. This forced advertisers toward broader targeting, Advantage+ approaches, and creative-led optimization. If you relied on exclusions to keep audiences “clean,” your campaign structure probably needs rebuilding.
Advantage+ Shopping Campaigns showed 70% year-over-year growth in Q4 2024. Meta’s answer to Google’s Performance Max — AI-driven campaigns that automatically find the best audiences, placements, and creatives. For ecommerce, this is rapidly becoming the default Meta campaign type.
Google’s Performance Max is now used by 71% of advertisers (Fluency Inc. 2026 survey). PMax runs across Search, Shopping, YouTube, Display, Discover, Gmail, and Maps from a single campaign. The tradeoff is control vs. automation — PMax’s lack of transparency frustrates operators, but its cross-inventory reach can be efficient for brands without time to manage separate campaigns per channel.
AI Max for Search expands keyword reach using intent signals beyond exact keyword matching, pushing Google further toward broad targeting + AI optimization.
Google Shopping conversion rates jumped from 10.9% to 15.3% in 2025 — a 40% increase. Product-level ads in search results continue to gain efficiency.
AI Overviews on Google Search are reducing organic click-through rates for some query types. For informational queries, the CTR impact is significant. For branded and transactional queries, the impact has been modest (5-12% reduction). This increases the relative value of paid placements on high-intent commercial searches.
The Real Cost Comparison: Per-Outcome, Not Per-Click
This is the section where most guides mislead. Comparing raw CPC across platforms without context is like comparing car prices without considering fuel costs, maintenance, and how far each car actually gets you.
The critical insight: Meta’s CPC is lower. Google’s conversion rate is higher. The platform that’s actually cheaper depends on your cost-per-conversion — and that depends on your product, funnel, and creative quality.
A $0.70 Meta CPC with a 1.5% conversion rate produces a $46.67 cost-per-conversion. A $2.69 Google Search CPC with a 4.4% conversion rate produces a $61.14 cost-per-conversion. But Google’s converter had purchase intent — they searched for your product. Meta’s converter was interrupted while scrolling. The Google customer may have a higher AOV and higher lifetime value.
Compare CPA, not CPC. And compare CPA in the context of average order value and customer lifetime value.
Targeting: Intent vs. Identity
Google targets what people want. Keyword targeting connects your ad to a search query at the moment of expressed intent. Contextual targeting matches your ad to relevant content across 2+ million Display Network sites. Audience targeting layers demographics, in-market signals, and remarketing on top. But the foundation is always intent — the user told Google what they want.
Meta targets who people are. Demographics, interests, behaviors, Lookalike Audiences, and custom audiences from your customer data. With the Andromeda update and Advantage+ Audience, Meta’s algorithm increasingly handles audience selection automatically, using behavioral data to find people most likely to convert. Lookalike audiences now operate as algorithmic suggestions rather than hard constraints.
The 2026 operational shift on Meta: creative IS the targeting. With detailed targeting exclusions removed, you can’t sculpt audiences the way you could in 2023. The algorithm finds your buyers through creative performance — which ads people engage with signals who the right audience is. A video ad featuring a woman using your skincare product in her 30s will naturally be served to women in their 30s interested in skincare. The creative does the targeting work that audience settings used to do.
Retargeting on both platforms: Meta uses the Meta Pixel (and Conversions API for server-side tracking). Google uses cookies and first-party data. Both support website visitor retargeting, customer list matching, and engagement-based audiences. Meta retargeting can boost engagement by 300% compared to standard ads (99Firms data). Google’s retargeting spans Search, YouTube, Shopping, Display, and Gmail.
Ad Formats and Creative
Google Ads formats: Responsive Search Ads (up to 15 headlines, 4 descriptions, AI-tested combinations), Shopping Ads (product images, prices, reviews in search results), YouTube video ads, Display Network banners, Performance Max (cross-format AI-optimized), Demand Gen (YouTube, Discover, Gmail).
Meta Ads formats: Image ads, video ads, carousel ads (up to 10 cards), Collection ads (open into full-screen Instant Experience), Reels ads (short vertical video between organic Reels — growing rapidly, often lower CPMs than Feed), Stories ads, lead form ads.
Where Meta wins: Visual creative flexibility. Meta offers more ad format variety and the platform rewards strong visual storytelling. Carousel and Collection ads create shopping experiences without leaving the app. Video and Reels ads have become the primary performance format on Meta in 2026.
Where Google wins: Relevance at the moment of intent. Google Search Ads don’t need to be visually compelling — they need to match what the user is looking for. Shopping Ads combine visual product information with purchase intent. YouTube provides video advertising at scale on the world’s second-largest search engine.
The creative production reality nobody mentions: Running Meta Ads effectively in 2026 requires refreshing creative every 2-3 weeks. Andromeda’s creative-quality weighting means stale creative doesn’t just fatigue — it gets more expensive. If you can’t produce 3-5 new creative assets per month, Meta will eat your budget with declining returns. Google Search Ads, by contrast, require minimal creative production — text headlines and descriptions cost almost nothing to produce.
Funnel Fit: Which Platform for Which Stage
Top of funnel (awareness, discovery): Meta wins. Lower CPMs, visual formats, interest-based targeting, and Reels placement create efficient awareness at scale. Google’s Display Network and YouTube also serve awareness, but Meta’s algorithmic targeting for cold audiences is more sophisticated.
Mid-funnel (consideration, education): Both platforms contribute. Meta retargeting keeps your brand visible to people who’ve engaged. Google captures mid-funnel research queries (“best CRM comparison,” “product reviews”). YouTube video ads demonstrate products in action.
Bottom of funnel (conversion, purchase): Google wins. Search Ads capture high-intent queries from users ready to buy. Shopping Ads convert browsers into buyers with product images, prices, and reviews in the SERP. Users who earlier saw your Meta awareness ads and later search your brand name on Google convert at 2-3x the rate of cold search traffic.
Post-purchase (retention, upsell): Meta wins. Retargeting existing customers with new products, seasonal offers, and loyalty content. Meta’s ability to target by purchase behavior and customer list matching makes it the stronger retention platform.
When to Use Google Ads
Google is the right primary investment when:
Your customers search for what you sell (service businesses, B2B, high-consideration purchases)
You need fast conversions from people with demonstrated purchase intent
You’re targeting branded keywords or competitor keywords
You sell products with clear search demand (Google Shopping)
You’re a local business where “near me” searches drive foot traffic
Your creative production capacity is limited (text-based Search Ads require minimal creative assets)
When to Use Meta Ads
Meta is the right primary investment when:
Your product solves a problem people don’t know they have (discovery-driven products)
Your product is visually compelling (fashion, home decor, food, beauty, lifestyle)
You’re building brand awareness in a new market
Your target audience can be defined by demographics, interests, or behaviors rather than search queries
You have strong creative production capacity (video, UGC, carousel assets refreshed regularly)
You’re in ecommerce — ThoughtMetric data shows 77.9% of ecommerce ad budgets went to Meta in Q3 2025
When to Use Both (Most Scaling Businesses)
The strongest accounts in 2026 run both platforms in a coordinated funnel:
Meta builds awareness → Google captures intent. Meta’s visual ads introduce your brand to cold audiences. Some won’t convert immediately. Days or weeks later, when the need crystallizes, they Google your brand name or a related search term. Your Google branded search campaign captures that intent at a fraction of cold search CPC. Nielsen analysis of CPG campaigns shows full-funnel strategies achieve up to 45% higher ROI compared to single-stage campaigns.
SEM data validates → Meta scales. Google’s search term reports show which queries convert and at what value. Test keywords with Google Search, then build Meta creative around the proven messaging. Scale the winners on Meta’s larger audience at lower CPMs.
Retargeting closes the loop. Users who click a Google ad but don’t convert → Meta retargeting keeps your brand visible → they return and convert. Users who engage with a Meta ad but don’t purchase → Google remarketing captures their next search.
Budget allocation starting point: For a new business running both, allocate 60% toward the platform closest to your conversion event — typically Google for service businesses, Meta for ecommerce — and 40% toward awareness on the other. Rebalance as data matures.
Minimum budget: Expect to spend at least $1,500/month per platform before generating statistically meaningful data. Below $1,000/month per platform, neither Google’s Smart Bidding nor Meta’s algorithm has enough conversion volume to optimize effectively.
Business-Type Recommendations
Ecommerce (DTC, product brands): Meta-first for product discovery and demand creation. Google Shopping and Search for bottom-funnel capture. Advantage+ Shopping Campaigns on Meta + Performance Max on Google is the standard dual-platform setup for scaling ecommerce in 2026.
Local services (plumbing, legal, medical, home services): Google-first. Customers search when they need you. Google Local Service Ads and Search Ads capture high-intent leads. Meta supplements with community awareness, review-driven trust building, and retargeting.
B2B SaaS:Google Search for high-intent queries (“best project management software”). Meta for retargeting website visitors and nurturing leads with case studies and product demos. LinkedIn may be more efficient for targeting specific job titles and company sizes, despite higher CPCs ($8-15).
Consumer apps: Meta-first for app install campaigns. Instagram and Reels placements reach mobile-native audiences. Google’s App campaigns (Universal App Campaigns) supplement across Search, YouTube, and Play Store.
High-ticket services (consulting, enterprise software, luxury): Google captures the research and comparison phase. Meta retargeting nurtures the long decision cycle. Both platforms contribute, but Google typically drives the final conversion for considered purchases.
The Attribution Problem
Conversion numbers will never perfectly match across Google, Meta, and your analytics platform. This isn’t a bug — it’s structural.
Meta’s default attribution window is 7-day click, 1-day view. Google’s default is 30-day click. Both platforms take credit for the same conversion if a user saw a Meta ad and later clicked a Google ad. Your analytics platform (GA4) uses its own attribution model, which often credits the last click.
The practical response: don’t chase perfect cross-platform attribution. Focus on: (1) consistent measurement rules across both platforms, (2) strong first-party tracking (server-side Meta Conversions API + Google’s Enhanced Conversions), and (3) incrementality testing (turn off one platform for a geography or audience segment and measure the impact on total business metrics).
The brands that win in 2026 aren’t the ones with perfect attribution. They’re the ones with clean tracking, consistent rules, and the discipline to evaluate platforms by their contribution to total business outcomes — not by the numbers each platform self-reports
Influencer marketing is no longer an experimental channel. 74% of brands are increasing their creator program budgets in 2026 — not as experiments, but as core revenue strategy measured by the same standards as paid media: customer acquisition cost, average order value, and return on investment.
The industry has grown from $1.4 billion in 2014 to a projected $24-33 billion in 2026, depending on the measurement source. 86% of consumers make at least one purchase inspired by an influencer annually. 92% of consumers trust influencer recommendations over traditional brand advertising. And the operational infrastructure — tracking links, affiliate platforms, social commerce, and AI-powered discovery — has matured enough that performance accountability is now the default expectation, not an aspirational goal.
This guide covers what influencer marketing is, the four strategies driving results in 2026, the influencer tiers and how to choose between them, platform selection, how to structure campaigns for measurable outcomes, and the trends reshaping the industry.
What Influencer Marketing Is
Influencer marketing is a strategic partnership between brands and individuals who have built credibility with specific audiences on social platforms. Instead of broadcasting a message through traditional advertising, brands work with content creators whose followers trust their opinions and recommendations.
The mechanism is “borrowed trust.” An influencer’s product recommendation feels like advice from a friend rather than a corporate advertisement. 92% of consumers trust influencer marketing over traditional advertising (Nielsen). 87% of surveyed millennials respond positively to product placements from their favorite digital personalities, compared to 84% who dislike or distrust traditional marketing.
The distinction from traditional advertising: traditional ads interrupt. Influencer content integrates into feeds users chose to follow. Traditional ads speak from the brand’s perspective. Influencer content speaks from the creator’s perspective, filtered through their authentic voice and existing audience relationship. This produces measurably different outcomes — influencer marketing delivers up to 11x better ROI than traditional marketing tactics, and influencer-generated content outperforms brand-created content according to 92% of marketers surveyed.
The Four Strategies Driving Results in 2026
Aspire’s 2026 analysis of campaign data and 900+ marketer/creator surveys identified four distinct influencer marketing strategies, each serving a different function in the funnel. The best-performing brands in 2026 run all four in combination.
1. Product Seeding
Product seeding — sending free products to targeted creators without requiring paid content in return — had a breakout year in 2025, accounting for 31% of all campaigns on Aspire (up from 20% the year before). It’s the most cost-effective entry point into influencer marketing.
The mechanics are simple: identify creators whose audience matches your target customer, send them your product, and let them decide whether and how to feature it. There’s no guaranteed post, which means the content that does get created is genuinely voluntary — and audiences can tell the difference.
Product seeding works as a discovery mechanism. It builds relationships with creators who may become paid partners later. And the organic content it generates carries higher trust signals than paid placements because it isn’t required or scripted.
2. Affiliate Marketing
Affiliate marketing is the strategy most aligned with 2026’s performance-accountability shift. Creators receive unique tracking links or discount codes, earn commission on resulting sales, and both parties share in the outcome.
Commission rates typically range from 5-30% depending on industry and product margin. The model has scaled significantly: creators drove over $52 million in attributed affiliate sales through Aspire alone in 2025, representing 45% year-over-year growth. 41% of creators participated in more than 5 affiliate campaigns over the past year, signaling growing acceptance of commission-based partnerships.
Hybrid compensation — a base fee plus performance commission — is becoming the standard. It balances guaranteed creator income with brand accountability. Creators who drive results earn more. Brands that measure properly scale budget with confidence.
TikTok Shop, YouTube Shopping, and Instagram Shopping have turned affiliate into social commerce: creators add shoppable links directly in their content, and viewers can purchase without leaving the platform. TikTok Shop adoption nearly doubled year-over-year, with 32% of brands already selling on the platform and another 25% planning to.
3. Sponsored Content and Ambassador Programs
Sponsored content — brands paying creators to feature products in their posts — remains the most visible form of influencer marketing. The evolution in 2026 is the shift from one-off posts to long-term ambassador programs.
Long-term partnerships outperform one-off campaigns because repeated mentions build trust and receive algorithmic lift (platforms reward consistent creator-brand relationships). Long-term partners understand the brand, know what performs, and improve with every collaboration. Vogue Business describes creators becoming “consultative and strategic collaborators,” not just distribution channels.
Ambassador programs typically include: ongoing content creation (monthly or quarterly deliverables), creative direction input (creators advise on what resonates), event attendance and brand representation, exclusivity within the product category, and escalating compensation as the partnership matures.
Pricing benchmarks for sponsored content: nano influencers often accept product exchange or $50-$250 per post. Micro influencers: $100-$500. Macro influencers: $500-$5,000. Mega influencers: $5,000-$10,000+, with top celebrities exceeding $1 million per post.
4. Creator-Led Paid Media (Whitelisting / Spark Ads)
This is the strategy most original guides miss entirely, and it’s the highest-leverage development in 2026.
77% of marketers now repurpose creator content in paid social ads and build it into their paid media strategy as a core creative input. Under Meta’s Andromeda update, which prioritizes creative volume and diversity over audience segmentation, performance depends on feeding the algorithm a steady stream of varied, high-quality creative. Creator content — different voices, formats, tones, and visual styles — provides exactly the creative diversity AI systems reward.
The mechanics: a creator produces content for your brand. You then run that content as a paid ad through your brand’s ad account (whitelisting on Meta) or as a Spark Ad on TikTok (boosting the creator’s organic post). The ad retains the creator’s name and profile, maintaining authenticity while getting paid media’s targeting and scale.
The results are significant. 69% of marketers say influencer-generated content performs better than brand-directed content in paid placements. Veradek’s off-season campaign used creator content that drove 27X ROAS — approximately 5X the rate of brand-produced creative.
This strategy also reduces the load on internal creative teams. Instead of producing original ad creative from scratch, brands source content from creators, boost the top performers, and let the algorithm optimize delivery.
Influencer Tiers: Who to Work With
Nano Influencers (1,000-10,000 followers)
Engagement rates up to 4.39% on Instagram — the highest of any tier. 63% of marketers prefer nano influencers (up 7% from 2023). 70% of brands focus on micro and nano influencers because they build trust and drive action effectively. Often compensated through product exchange, making them the most budget-friendly tier. Best for: hyperlocal campaigns, niche communities, authentic product seeding, testing new markets.
Micro Influencers (10,000-100,000 followers)
The top choice for 44% of marketers by 2025-2026. Engagement rates 7x higher than mega influencers. Posts typically cost $100-$500. Strong conversion rates through deeper audience connections. Best for: targeted campaigns with conversion goals, building a roster of reliable content partners, affiliate programs.
Macro Influencers (100,000-1M followers)
Substantial reach with reasonable audience alignment. Posts typically $500-$5,000. More professional operations with media kits and rate cards. Best for: brand awareness campaigns, product launches that need scale, reaching new audience segments.
Mega Influencers (1M+ followers)
Maximum reach, minimum engagement rate per follower. $5,000-$10,000+ per post, up to $1M for top celebrities. Best for: mass-market awareness, press coverage generation, major product launches where immediate visibility outweighs per-follower efficiency.
The Tier Selection Principle
Engagement rate matters more than follower count. A community of 10,000 engaged followers often produces better business outcomes than millions of passive ones. Nano influencers generate more revenue per follower than larger creators (2024 study). 50% of marketers identify nano influencers as cost-effective, while 44% value their stronger engagement rates.
Platform Selection
Instagram remains the leading influencer marketing platform — 72% of marketers chose it for campaigns. Strong for: lifestyle, fashion, beauty, food, travel. Formats: Feed posts, Stories, Reels, long-form video. Instagram Shopping enables in-app purchase. Mature affiliate infrastructure through bio links and Story swipe-ups.
TikTok drives the fastest growth in influencer marketing. Over 1 billion active users worldwide, 150M+ in the U.S. 34% of TikTok users buy products based on influencer suggestions. The algorithm favors content quality over follower count, giving smaller creators viral potential. TikTok Shop has become a major social commerce channel. 40%+ of Gen Z prefer TikTok for product discovery over Google. Formats: in-feed videos, hashtag challenges, duets, stitch, branded effects, live shopping.
YouTube functions as both a social platform and the world’s second-largest search engine. 6 in 10 YouTube subscribers trust their favorite creator’s advice more than TV or movie stars. Over 90% of users discover new brands or products through YouTube. YouTube Shopping enables product links in videos and Shorts. Best for: long-form product demonstrations, tutorials, reviews, education content. YouTube Shorts adds short-form capability alongside long-form authority.
LinkedIn offers untapped B2B influencer marketing potential. 4 out of 5 LinkedIn members make business decisions. B2B influencers provide: enhanced trust, targeted reach to decision-makers, quality content, and industry authority. 57% of marketers plan to increase LinkedIn activity. Best for: professional services, SaaS, enterprise, thought leadership.
Platform diversification matters. Users spend time on up to 6 platforms per month. The strongest programs create platform-specific strategies rather than repurposing identical content everywhere. TikTok attracts younger demographics; Instagram appeals to broader age ranges; YouTube builds long-form authority; LinkedIn reaches professional decision-makers.
How to Build a Program That Performs
Define Goals Around Business Outcomes
The shift in 2026: goals are defined by revenue contribution, not vanity metrics. Awareness goals (impressions, reach, audience growth) still matter for top-of-funnel, but the program must ultimately connect to CAC, AOV, and ROI.
Typical budget split: 65% creator fees, 10% product costs, 15% paid amplification (whitelisting/Spark Ads), 10% technology and management tools. Most brands (67%) spend under $50,000 annually. Scale examples:
Small ($5K-$10K): 5-10 nano influencers via product seeding + paid boost on top performers
Medium ($15K-$35K): 3 micro + 2 mid-tier influencers with hybrid compensation
Large ($50K-$150K): Tiered program mixing macro, micro, and nano across multiple platforms
Factor in hidden costs: product shipping, content rights/licensing fees, analytics platform subscriptions, paid amplification budget, and creator management time.
Write a Brief, Not a Script
This is the single most important creative principle in 2026. 69% of marketers say influencer-generated content outperforms brand-directed content. 79% of consumers say UGC influences buying decisions. Brands that hand creators a script get content that looks scripted. Brands that hand creators a brief — with clear goals but creative freedom — get content that performs.
Your brief should include: campaign objective, key message (one sentence), product focus, CTA, platform requirements, content format, timeline, disclosure requirements, and what NOT to say. It should NOT include: word-for-word scripts, shot-by-shot video direction, or tone requirements that override the creator’s natural voice. The more you control the content, the less it performs.
Set Up Attribution Before Launch
Only 20% of brands track customer acquisition cost from influencer campaigns. The 80% making budget decisions on gut feel are at a structural disadvantage. Before any campaign launches, establish:
Unique tracking links (UTM parameters) per creator
Post-campaign surveys (“How did you hear about us?”)
Google Analytics UTM tracking for website traffic attribution
Track and Optimize in Real Time
Monitor live metrics — engagement rates, click-through rates, conversion rates, attributed revenue — and adjust mid-campaign. Identify top-performing creators and content formats early. Shift budget toward what’s working.
Post-campaign, build a performance dashboard showing: total program ROAS, customer acquisition cost by influencer tier, revenue per creator, content performance by format and platform, and year-over-year growth metrics. This data informs which creators to retain, which tiers to invest in, and which content approaches to scale.
Compliance and Disclosure
Regulatory requirements are tightening across markets in 2026. The FTC is cracking down on undisclosed partnerships. The EU’s Digital Services Act adds new transparency rules. UK regulations require clear disclosure of commercial relationships.
Every influencer brief must include disclosure requirements. Minimum standard: clear labels like #ad, #sponsored, or “Paid partnership with (brand)” visible without requiring users to expand the caption. Brands without clear disclosure guidelines in their creator briefs are taking on legal risk they don’t need.
AI-generated content adds a new layer: if creators use AI tools to produce or substantially alter sponsored content, emerging regulations and platform policies increasingly require disclosure of AI involvement. Define where AI is allowed (captions, editing, planning) and where it’s not (fabricating testimonials or results).
What’s Coming Next
Performance replaces vanity. Every creator partnership will be tied to measurable ROI. Attribution infrastructure is becoming the competitive moat — the brands that fix attribution first will outperform the rest.
Social commerce becomes default. TikTok Shop, YouTube Shopping, Instagram Shopping turn creator content into direct sales channels. The line between “content” and “store” continues to dissolve.
Creator-led paid media scales. As Meta’s Andromeda and Google’s AI-driven ad systems prioritize creative diversity, creator content becomes the most efficient input for paid social and video campaigns.
Long-term partnerships replace one-offs. Performance trends upward across activations when creators understand the brand and the feedback loop. The measurable win is compounding improvement, not one-time spikes.
AI powers operations, not creativity. 59% of marketers use AI for creator discovery, workflows, and analytics. 86% of creators use generative AI in their content process. But audiences still detect AI-generated content, and the trust hit when they do is severe. AI is most valuable in operations and production support. Human creators remain the trust engine.
Tupa helps international e-commerce and B2B companies grow profitably through data-driven Google Ads and SEO – with the execution speed of a China-based team and the transparency you expect from a Western agency.
Tupa is a certified partner in Google Ads
Kiara Foster
Head of Content
Kiara
Edit this chat template from WP Admin > Templates > Floating Elements