Global advertising spend crossed $1.14 trillion in 2025. Digital channels now command 68.7% of total marketing investment. And the number of platforms competing for your ad dollars keeps growing—from the established giants (Google, Meta) to fast-scaling challengers (TikTok, Amazon) to entirely new categories that barely existed three years ago (Connected TV, retail media networks, AI search placements).
The platform you choose determines whether your advertising budget generates profitable growth or evaporates into vanity metrics. Google captures high-intent search demand. Meta creates demand from cold audiences through AI-optimized creative. TikTok reaches younger consumers through algorithm-driven discovery. Amazon converts shoppers already in buying mode. LinkedIn targets professionals by job title and company. YouTube tells stories on the biggest screen. CTV delivers TV-quality reach with digital precision. And programmatic platforms stitch it all together.
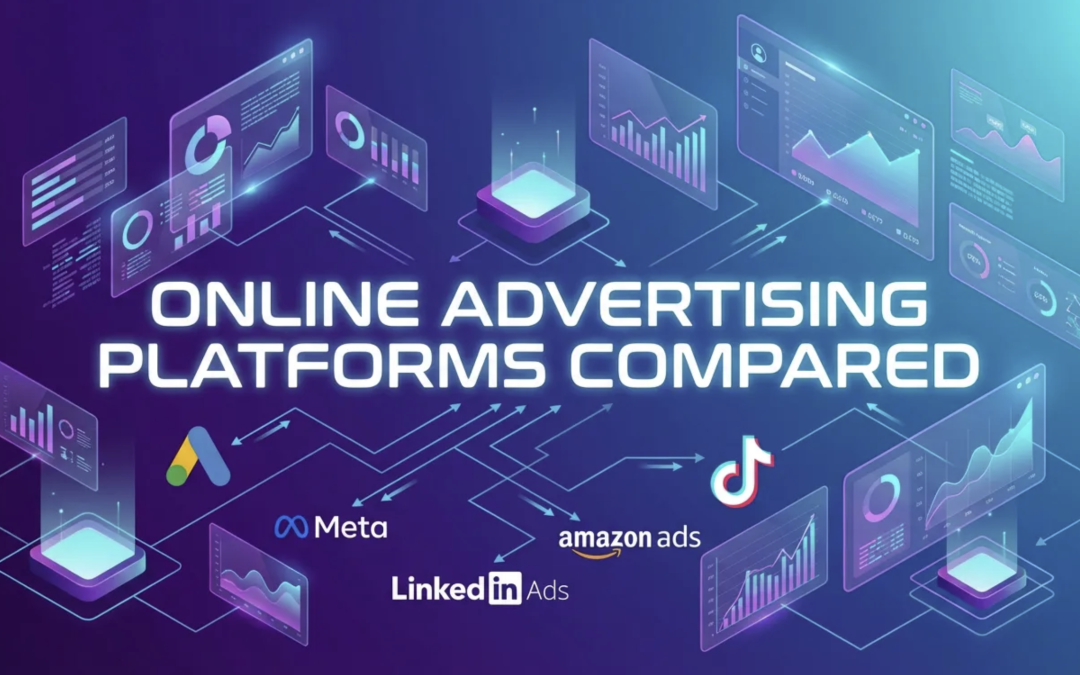
This guide compares every major advertising platform in 2026 by what it does best, what it costs, who it works for, and how it fits into a multi-platform strategy. No platform rankings based on popularity. Instead, a decision framework based on your business type, funnel stage, and budget reality.
Google Ads: Capturing Intent at the Moment of Decision
Google holds 83% of global search market share. When someone types a query with buying intent—”best CRM software,” “emergency plumber near me,” “buy running shoes online”—Google connects that intent with your ad. No other platform replicates search intent at this scale.
What Has Changed in 2026
Performance Max dominance. Performance Max campaigns now serve ads across Search, YouTube, Display, Gmail, Maps, and Discover through a single campaign with AI-driven optimization. Advertisers using Performance Max see an average 18% increase in total conversions at similar cost per action. The campaigns work best when paired with high-quality first-party customer data—Customer Match lists, website visitor data, and CRM uploads feed the algorithm with signals about who your best customers look like.
Keywordless targeting. Google’s AI now goes beyond keyword matching to understand search intent directly. Performance Max uses this technology to find converting queries that traditional keyword research misses. This represents a fundamental shift: advertisers provide creative assets, audience signals, and conversion goals; Google’s machine learning handles the targeting.
First-party data infrastructure. With third-party cookies effectively deprecated across major browsers (Safari and Firefox already block them; Chrome’s Privacy Sandbox has fundamentally changed tracking), first-party data is the foundation of Google Ads performance. Google’s Confidential Matching encrypts and protects uploaded customer data. Google Ads Data Manager simplifies the connection between your CRM and Google’s ad systems.
Performance Benchmarks
Average CPC varies dramatically by industry: $1-$2 for ecommerce, $2-$5 for SaaS, $6-$15 for legal and financial services, $6-$15 for locksmith and home services. Average conversion rate across industries is 4.4% for search campaigns. ROAS for well-optimized ecommerce Shopping campaigns typically ranges from 4x to 8x.
Best For
Businesses with products or services people actively search for. Any business where capturing existing demand (rather than creating awareness) is the priority. Required foundation for nearly every advertising strategy—even businesses that primarily run social ads should capture branded search through Google.
Meta Ads: Creating Demand Through AI-Powered Discovery
Meta’s advertising ecosystem reaches 3.43 billion daily active users across Facebook, Instagram, Messenger, WhatsApp, and now Threads. The platform generated over $196 billion in advertising revenue in 2025 with more than 10 million active advertisers.
What Has Changed in 2026
Andromeda algorithm. Launched in 2024, Andromeda fundamentally changed how Meta targeting works. Instead of advertisers manually selecting interest-based audiences, the algorithm uses your ad creative to find the most relevant audience. This means broad targeting—even targeting entire countries without age or gender restrictions—now outperforms hyper-segmented manual targeting for most advertisers.
Advantage+ maturity. Meta’s Advantage+ suite has evolved into a genuinely powerful automated system. Advantage+ Shopping Campaigns (ASC) deliver 12-25% higher ROAS than manually managed campaigns for accounts spending over $5,000/month. The key: feed the system 6-10 diverse creative variations (video, static, carousel) and sufficient budget to exit the learning phase.
Cross-platform optimization. Campaigns running across Facebook, Instagram, and the Audience Network reach 7% more people than single-platform campaigns and produce 1.67x more converters with 3.45x more conversions. Users who see ads across all three platforms convert 8x more than those seeing ads only on Facebook. “All Placements” consistently outperforms platform-specific placement restrictions.
Threads ads. Meta has introduced advertising on Threads, managed through Meta Ads Manager with image and carousel formats. Early CPMs are competitive, making Threads a low-cost testing ground for brands already running Meta campaigns.
Performance Benchmarks
Average ROAS across Meta: 4.2x (highest of any social platform). Average CPM: $8-$12 for Facebook, $6-$10 for Instagram Reels. Instagram Reels ads that mimic organic content see 15-40% higher CTR than obviously branded creative. The first 3 seconds determine whether viewers swipe—hook with conflict, curiosity, or an unexpected visual.
Best For
Ecommerce brands with strong visual creative. Demand generation for products people do not know they want yet. Retargeting across the full customer journey. Any business where visual storytelling drives purchase decisions. The most versatile social advertising platform for both B2C and B2B awareness.
YouTube Ads: Video Storytelling at Scale
YouTube combines Google’s targeting precision with video’s emotional impact. You can reach someone who searched “best CRM software” on Google last week, then serve them a 2-minute product demonstration on YouTube while they watch content.
Key Formats
Skippable in-stream ads play before, during, or after videos. Viewers can skip after 5 seconds. Advertisers pay only when viewers watch 30+ seconds or interact. Best for consideration and conversion campaigns.
Non-skippable ads force complete viewing. 6-second bumper ads build frequency. 15-30 second ads deliver full messages. 30-second Connected TV-specific ads reach the living room screen.
YouTube Shorts ads reach over 2 billion monthly logged-in users. 45% of Shorts users do not use TikTok, and 65% stay off Instagram—unique audiences you cannot reach elsewhere. YouTube delivers 2.3x better long-term ROAS than paid social according to Google-commissioned research.
Video ad sequencing tells connected stories across multiple videos in a specific order—introduce and reinforce, prompt and inspire, or multi-part narratives that build brand over time.
Performance Benchmarks
YouTube advertising grew 51% in 2025 vs 2024, with 43% growth expected in 2026. 62% of US agencies plan to use YouTube on TV screens in 2026. Creator ads on Shorts boost purchase intent by 8.8%, generating 2.9x more consumer spending interest vs competitors.
Best For
Brand awareness and storytelling campaigns. Products that benefit from demonstration. Full-funnel strategies that combine YouTube awareness with Google Search conversion. Reaching Connected TV audiences through YouTube’s TV app.
Microsoft Advertising: The Underpriced Alternative
Microsoft Advertising reaches users across Bing, Yahoo, AOL, Edge, and Copilot. While Bing holds less than 10% of global search share, the platform offers structural advantages that make it a smart addition to any search advertising strategy.
Why It Deserves Budget
Lower CPCs. Microsoft Advertising CPCs are consistently 30-50% lower than equivalent Google Ads keywords. Less advertiser competition means your budget stretches further.
Higher-value audience. The Bing audience skews older and higher-income—demographics with greater purchasing power for premium products and services.
Easy setup. You can import your entire Google Ads account structure—campaigns, ad groups, keywords, bids—directly into Microsoft Advertising. Setup takes minutes.
AI assistant visibility. Merchants running Bing Shopping campaigns automatically get visibility in Microsoft Copilot responses. As AI assistants handle more commercial queries, this visibility becomes increasingly valuable at no extra cost.
Best For
Any business already running Google Ads that wants to extend reach at lower cost. B2B advertisers targeting enterprise decision-makers (Microsoft’s audience over-indexes for business professionals). A second search platform to test before scaling budget.
LinkedIn Ads: B2B Precision That Justifies Premium Pricing
LinkedIn connects over 1 billion professionals worldwide and remains the only platform that lets you target by job title, seniority level, company size, industry, and specific company names. For B2B marketers, this targeting precision is unmatched.
Key Formats and Features
Sponsored Content appears natively in the LinkedIn feed. Running multiple ad variations (up to 5 simultaneously) improves performance.
Message Ads deliver directly to prospects’ LinkedIn inboxes with one clear CTA. Over 50% of prospects open LinkedIn Message Ads—166% higher than email marketing open rates. Keep messages under 500 characters with personalized greetings.
Lead Gen Forms auto-fill with LinkedIn profile data, reducing friction to a couple of clicks for lead capture.
Account-Based Marketing (ABM). Upload target company lists and match them against LinkedIn’s 13+ million Company Pages. Pilot campaigns using Matched Audiences saw a 32% increase in post-click conversion rates and 4.7% decrease in cost per conversion.
Performance Benchmarks
LinkedIn CPCs run $6-$12—3-5x more than Google Ads. But the lead quality justifies the premium for B2B. LinkedIn-sourced leads show 40-50% higher lifetime value than leads from other platforms, even though they convert 20-30% slower on immediate response campaigns. Document Ads typically deliver the best engagement-to-cost ratio at top of funnel.
Best For
B2B companies selling to specific job titles, industries, or company sizes. Professional services firms and SaaS companies with high-value contracts and long sales cycles. ABM programs targeting named accounts.
Amazon Ads: Converting Shoppers Already in Buying Mode
Amazon gives advertisers direct access to shoppers with purchase intent. Over 310 million active customers. Businesses using Sponsored Products grow sales 34% more than those that do not advertise.
Key Formats
Sponsored Products are CPC ads promoting individual listings within search results and product pages. No minimum spend. Pay only on clicks.
Sponsored Brands display customizable headlines, logos, and multiple products at the top of search results.
Amazon Attribution tracks how non-Amazon marketing (search, social, email) influences Amazon purchases. Brands using Attribution insights saw an 18% increase in new-to-brand sales.
Off-site Sponsored Products extend ads to third-party sites like Pinterest and BuzzFeed, reaching consumers earlier in their shopping journey without Amazon DSP.
Best For
Any business selling physical products on Amazon. Brands wanting to measure cross-channel impact on marketplace sales. Product-based businesses where the transaction will happen on Amazon regardless—advertising ensures you capture those sales instead of competitors.
TikTok Ads: Algorithm-Driven Discovery for Younger Audiences
TikTok has 1.59 billion monthly active users and processes advertising through one of the most sophisticated recommendation algorithms in digital marketing. Its Smart+ campaigns use machine learning to match ads with the users most likely to engage, requiring minimal targeting input from advertisers.
Why TikTok’s Algorithm Is Different
TikTok surfaces content based on engagement signals, not follower count. This gives newer brands organic reach potential alongside paid campaigns. But the platform demands a fundamentally different creative approach—highly produced, brand-forward ads dramatically underperform compared to native-looking content that blends with organic feed videos.
Performance Benchmarks
TikTok delivers the lowest CPM of any major platform at approximately $3.50. 72% of Gen Z have purchased products directly through social apps, with TikTok and Instagram as the primary discovery channels. 23.2% of Gen Z users cite TikTok as their top product discovery source—surpassing Google at 18.8%.
Best For
Brands targeting Gen Z and younger Millennials. Products that benefit from demonstration, tutorial, or creator-driven content. Ecommerce brands with Shopify, WooCommerce, BigCommerce, or Ecwid integrations for seamless in-app purchasing. Awareness campaigns where low CPM makes reach affordable.
Instagram Ads: Visual Commerce and Shoppable Discovery
Instagram has shifted heavily toward video, with the majority of ads now running on Reels. Users spend approximately 55 minutes daily watching short-form videos on the platform.
Instagram’s shoppable posts have converted the platform into a complete shopping ecosystem. Users can purchase products tagged directly in posts without leaving the app. Brands using shoppable posts have seen sales increase by 42% and website traffic grow by 98%.
30.4% of Gen Z users cite Instagram as their top product discovery source—the highest of any platform. Instagram excels at passive discovery: products appear naturally in feeds, driving impulse purchases from audiences who were not actively searching.
Best For
Lifestyle, fashion, beauty, food, travel, and home decor brands. DTC brands with strong visual identity. Ecommerce businesses that benefit from shoppable posts and product tagging. Any brand targeting the 18-44 demographic with visual creative.
Connected TV (CTV): The Biggest Screen Meets Digital Precision
CTV advertising has crossed a strategic threshold. Streaming viewership officially eclipsed combined broadcast and cable reach in May 2025. CTV ad spend is projected to reach $38.36 billion by 2026, with 84% of advertisers confirming CTV delivers better targeting capabilities than linear TV.
How CTV Advertising Works
CTV ads are served programmatically through streaming apps on smart TVs, Roku, Apple TV, Fire TV, and gaming consoles. Advertisers purchase inventory through DSPs (The Trade Desk, Amazon DSP, DV360) or directly from publishers (Hulu, Roku, YouTube on TV). Targeting uses household-level data, behavioral signals, and first-party data segments—far more precise than traditional TV’s broad demographic buying.
Why CTV Matters in 2026
Retail media convergence. Retail media networks are merging first-party shopping data with CTV delivery. Amazon’s CTV inventory connects premium video exposure to actual shopping behavior—you can link a streaming ad directly to downstream purchase data. Retail media CTV spending is projected to grow from $4.46B in 2025 to $9.03B by 2029.
Netflix goes programmatic. Netflix ads will be available through Amazon DSP, joining a rapidly expanding universe of premium CTV inventory accessible through programmatic buying.
Performance metrics. CTV ads deliver near-100% video completion rates (many are non-skippable), cross-device attribution to website visits and purchases, and store visit attribution linking TV exposure to physical retail trips.
Best For
Brands that need TV-quality reach with digital measurement. Businesses combining awareness (CTV) with performance (search, social) in full-funnel campaigns. Any advertiser spending $10,000+/month who wants to extend beyond social and search.
Retail Media Networks: Advertising Where People Buy
Retail media is the fastest-growing advertising channel in 2026. Amazon, Walmart, and major retail networks collectively attract over 15% of total digital ad budgets. Over half of marketers plan to shift spend from open-web DSPs to retail media DSPs.
Beyond Amazon
Walmart Connect reaches Walmart’s massive in-store and online audience with Sponsored Products, display ads, and in-store digital signage.
Instacart Ads target grocery shoppers at the point of purchase decision, with high conversion rates for CPG brands.
Target Roundel (formerly Target Media Network) offers audience targeting based on Target’s first-party purchase data.
Why Retail Media Is Growing
The commerce data powering retail media DSPs is becoming the infrastructure that informs targeting, optimization, and measurement across the entire programmatic ecosystem. Closed-loop attribution—connecting ad exposure directly to verified purchases—provides a level of measurement accountability that walled garden social platforms cannot match.
Best For
CPG brands selling through major retailers. Ecommerce brands selling on Amazon, Walmart, or Instacart. Any product-based business where the transaction happens on a retail platform.
Additional Platforms Worth Testing
Pinterest Ads — Users arrive with high purchase intent. Pinterest functions as a visual search engine for products, making it strong for DTC, home, fashion, and food brands. Lower CPCs than Meta for many categories.
Reddit Ads — Community-driven targeting reaches highly engaged niche audiences. Strong for tech, gaming, finance, and B2B SaaS. Reddit’s conversation-based format creates higher trust around product recommendations than traditional feed ads.
X (Twitter) Ads — Best for real-time event marketing and time-sensitive promotions. Over 500 million monetizable monthly active users. Less effective for sustained demand generation but powerful for cultural moments and live events.
Programmatic Display (DSPs) — The Trade Desk, DV360, and Amazon DSP let you buy ad inventory across the open web, CTV, audio, and DOOH (digital out-of-home). Programmatic will account for 90% of global digital display ad spend by 2026. Essential for brands spending $50K+/month that need reach, frequency control, and cross-channel coordination beyond what walled garden platforms provide.
How to Choose: Platform Selection Framework
By Business Type
Ecommerce (physical products): Google Shopping + Meta + Amazon Ads. Add TikTok for Gen Z audiences. Add Walmart Connect/Instacart if selling through those retailers.
SaaS / B2B: Google Search + LinkedIn + YouTube. Add Microsoft Advertising for lower-cost search traffic. Meta for retargeting and awareness.
Local services: Google Search + Google Local Services Ads + Meta (geographic targeting). Add Microsoft Advertising as a secondary search channel.
DTC / lifestyle brands: Meta (primary) + TikTok + Instagram Shopping + Pinterest. Add Google Search for branded capture. Add YouTube for storytelling.
Enterprise / high-ticket B2B: LinkedIn (primary) + Google Search + YouTube. ABM programs through LinkedIn Matched Audiences. CTV for executive-level brand awareness.
By Funnel Stage
Top of funnel (awareness): YouTube, TikTok, CTV, Meta video campaigns — 25-35% of budget
Mid funnel (consideration): Meta retargeting, Google Display, YouTube remarketing — 15-25% of budget
Bottom of funnel (conversion): Google Search, Google Shopping, Amazon Ads, LinkedIn Lead Gen — 40-50% of budget
Retention / expansion: Meta Custom Audiences, Google Customer Match, email — 5-10% of budget
Budget Allocation: The 70/20/10 Framework
Spreading budget equally across five platforms is worse than concentrating on two platforms with proper measurement. The 70/20/10 framework provides structure:
70% to your proven performer. The platform with the best ROAS, the most conversion data, and the strongest operational infrastructure. For most businesses starting out, this is Google Ads or Meta Ads.
20% to your secondary platform. A channel with demonstrated potential that you are actively scaling. Enough budget to exit learning phases and generate statistically meaningful data.
10% to testing. New platforms, new ad formats, emerging channels. Run tests for 60 days at minimum viable budget ($1,500-$3,000/month) before evaluating. Kill tests that do not show directional promise. Scale tests that do.
Dynamic Reallocation Triggers
Do not set budget allocations once and forget them. Rebalance monthly with small adjustments (10-15% shifts). Full allocation review quarterly.
Scale signal: Platform consistently exceeds target ROAS by 20%+ for 30+ days, with audience saturation below 60%. Increase budget 25-50% over 2-4 weeks.
Cut signal: ROAS stays below 2.0x for 60+ days despite optimization. Investigate root causes (creative fatigue, competitive pressure, landing page issues) before cutting. If the problem persists, reallocate to higher-performing channels.
Cross-platform awareness: Meta awareness campaigns drive Google branded search. Cutting Meta awareness budget today reduces branded search volume in 30-60 days, making Google less efficient. Diagnose actual bottlenecks before cutting upper-funnel investment.
Privacy, Attribution, and First-Party Data
The Tracking Reality in 2026
Third-party cookies are effectively dead. iOS App Tracking Transparency limits Meta and mobile tracking. Browser-level privacy features block cross-site tracking by default. Platform-reported attribution increasingly diverges from actual customer behavior.
What This Means for Advertisers
Server-side tracking is mandatory. Conversion APIs (Meta CAPI, Google Enhanced Conversions) send conversion data directly from your server to ad platforms, bypassing browser restrictions. Without server-side tracking, your campaign data is incomplete and your optimization suffers.
First-party data is your competitive advantage. Email addresses, CRM records, website behavior data collected with consent—this data powers Customer Match audiences on Google, Custom Audiences on Meta, and Matched Audiences on LinkedIn. Companies with robust first-party data collection systems now have significant advantages.
Multi-touch attribution is essential. Last-click attribution systematically undervalues social advertising, which frequently initiates customer journeys that conclude through search or direct traffic. Invest in multi-touch attribution models or incrementality testing to understand how each platform actually contributes to revenue.
Platform-reported data is an input, not a verdict. Every platform has a financial incentive to show favorable results. Use platform data as one signal among many—cross-reference with your own analytics, CRM data, and blended ROAS calculations.
Measuring What Matters
Track these metrics across all platforms:
Blended ROAS: Total revenue divided by total ad spend across all platforms. This single number tells you whether your overall advertising investment is profitable, regardless of which platform gets attribution credit.
Cost per acquisition (CPA) by platform: Compare acquisition costs across channels, but weight for customer quality—a $100 CPA on LinkedIn that produces $10K lifetime value customers is better than a $30 CPA on Facebook that produces $200 lifetime value customers.
Incremental lift: Use holdout studies or geo-lift tests to measure what advertising actually adds above your baseline revenue. This separates true incremental value from demand you would have captured anyway.
Creative performance: Across all platforms, creative quality is now the primary lever for performance. AI-driven bidding and targeting have made campaign structure less differentiated—the creative is what determines whether your ad wins the auction and converts the viewer.
Where to Start
If you are building your first multi-platform advertising strategy, follow this sequence:
Month 1: Launch on one primary platform (Google Ads if demand exists for your product; Meta Ads if you need to create demand). Build conversion tracking, install server-side tracking, and validate your conversion rate before expanding.
Month 2-3: Add a second platform. Import Google campaigns to Microsoft Advertising for incremental search traffic. Or add Meta retargeting if you started with Google. Validate measurement across both platforms.
Month 3-6: Apply the 70/20/10 framework. Scale your primary performer. Test a third platform (YouTube, TikTok, LinkedIn, Amazon—based on your business type). Implement multi-touch attribution.
Ongoing: Rebalance monthly. Test new platforms and creative formats with 10% of budget. Invest in first-party data infrastructure. Measure blended ROAS and incremental lift, not just platform-reported metrics.
Two platforms measured well will consistently outperform five platforms measured poorly. Start concentrated, validate measurement, then expand strategically. The businesses that win in 2026 are the ones that know exactly which touchpoints drive revenue and can reallocate resources the moment performance shifts.