Good Christmas puns walk a fine line. They should be clever enough to earn a real laugh and corny enough to earn a groan — ideally both at the same time. The ones that stick are short, unexpected, and work whether you drop them into a holiday card, an Instagram caption, a family dinner, or an office email.
This collection covers every corner of Christmas wordplay: Santa puns, elf puns, reindeer puns, snow puns, tree and decoration puns, gift and wrapping puns, food and drink puns, carol-inspired puns, romantic holiday puns, kid-friendly puns, office party puns, and the pet Christmas puns your dog-obsessed cousin has been waiting for.
Santa Puns
Santa carries the heaviest pun workload every holiday season. These Claus-related one-liners work in cards, captions, and conversations.
What does Santa suffer from when he gets stuck in a chimney? Claustrophobia.
Why does Santa go down chimneys? Because it soots him.
What does Santa ride instead of a motorcycle? A Holly Davidson.
What’s Santa’s favorite type of music? Wrap.
Who is Santa’s favorite singer? Elf-is Presley.
What does Santa order at the coffee shop? A grande sleigh-shot espresso.
Why did Santa go to the doctor? He had low elf esteem.
How does Santa take pictures? With his North Pole-aroid camera.
Why did Santa get a parking ticket? He left his sleigh in a snow parking zone.
What do you call people who are afraid of Santa Claus? Claustrophobic.
What do Santa’s helpers learn at school? The elf-abet.
How much did Santa pay for his sleigh? Nothing — it was on the house.
What nationality is Santa Claus? North Polish.
Why does Santa always enter through the chimney? Because he has the key to no door.
What do you call Santa when he stops moving? Santa Pause.
Dear Santa, before I explain — how much do you know already?
Santa saw your Instagram. You’re getting clothes and a Bible.
Sources say nice list negotiations are still ongoing.
The Christmas spirit really soots you.
Believe in Santa? I believe in Santa Claus-tomer satisfaction.
Elf Puns
These tiny helpers generate outsized wordplay. Elf puns work especially well for captions and gift tags.
What do you call an elf who sings? A wrapper.
What do you call an elf who won’t share? Elfish.
What do elves post on social media? Elfies.
What kind of cars do elves drive? Toy-otas.
What do elves eat for breakfast? Frosted Flakes.
What bread do elves use for sandwiches? Shortbread.
What do you call a self-taught elf? Elf-educated.
What do you call a rich elf? Welfy.
What do you call an elf entrepreneur? An elf-made man.
Don’t be elfish — share the holiday spirit.
Just be your elf.
Believe in your elf.
Have your elf a merry little Christmas.
Pull your elf together — it’s the holidays.
All by my elf on Christmas Eve.
Treat yo’ elf this holiday season.
The best way to spread Christmas cheer is singing loud for all to hear — or just being your elf.
Reindeer Puns
Rudolph and his team offer puns that range from groan-worthy to genuinely clever.
What do you call a blind reindeer? No eye deer.
What do you call a blind reindeer with no legs? Still no eye deer.
Which reindeer has the worst manners? Rude-olph.
Which reindeer is the best at cleaning? Comet.
What do reindeer say before telling a joke? This one will sleigh you.
Why is Prancer always wet? Because he’s a rain-deer.
What do reindeer hang on their Christmas trees? Horn-aments.
What’s a reindeer’s favorite game? Stable tennis.
It looks like rain, dear.
Make it rein, deer.
Dasher through the snow.
You sleigh me.
Oh deer, Christmas is here.
I’m Vixen it for the holidays.
Dachshund through the snow (for dachshund owners pulling double duty).
Snow and Winter Puns
These puns thaw social awkwardness and work in both captions and conversations.
There’s snow place like home.
You’re snow cute.
I love you snow much.
Snow big deal.
I’m snow happy to see you.
What a winter-ful world.
Don’t flurry, be happy.
Freeze a jolly good fellow.
The snuggle is real.
Love at frost sight.
I came, I thawed, I conquered.
Icy what you mean.
Ice to meet you.
This weather is snow joke.
Chillin’ like a snow villain.
I’m so anti-snow-cial in winter.
Let it snow, let it snow, let it glow.
Cold hands, warm heart.
What do snowmen eat for breakfast? Ice Krispies.
What do you call a snowman with a six-pack? An abdominal snowman.
Why did the snowman call his dog Frost? Because Frost bites.
What’s a snowman’s favorite drink? Iced tea.
How do snowmen get around? On their icicle.
What do snowmen wear on their heads? Ice caps.
What do you call a snowman in July? A puddle.
Christmas Tree and Decoration Puns
The centerpiece of every living room generates its own branch of wordplay.
These decorations are tree-mendous.
Let’s spruce things up.
I’m feelin’ pine.
Are you fir real?
Fir sure!
Make like a tree and leave the decorating to me.
I love you a whole watt.
Ready, set, glow.
This tree is officially lit.
Twinkle with joy.
Can I get a watt watt?
Feeling tinsel-ated.
Tinsel be the reason you smile today.
Don’t get your tinsel in a twist.
Sparkle more, stress less.
Oh Christmas tree, oh chemis-tree.
Tree goals achieved.
I wood never leaf you — especially at Christmas.
What’s every Christmas tree’s favorite candy? Orna-mints.
Why are Christmas trees bad at sewing? They always drop their needles.
What did the ornament say to the tree? Quit hanging around.
I’m hooked on Christmas ornaments.
Star-struck by this holiday season.
Looking good, feeling pine.
Now don’t get sappy, but I’ll never fir-get you.
Gift, Wrapping, and Shopping Puns
These puns belong on gift tags, in shopping-related posts, and in that group chat where everyone’s complaining about holiday budgets.
That’s a wrap!
I’m in a giving mood — it’s present tense.
This gift really ties things together.
You’ve been gifted with my presence.
My presence is your present.
I’m ribbon you the wrong way? Sorry, can’t help it.
My gift-wrapping skills are on a roll.
All wrapped up in the holidays.
Bow down to the season.
The shopping is done — that’s a wrap, folks.
Under pressure? Must be under the tree.
I have no gift for wrapping, but I make up for it with charm.
Tag, you’re gift.
No returns on this friendship — it’s a keeper.
You deserve the present moment.
Yule never guess what I got you.
I’m a present-day optimist.
This is my cardio — running to the mall.
I shop, therefore I Claus.
Christmas Food and Drink Puns
Holiday feasts and treats fuel some of the season’s best wordplay.
Season’s eatings!
Christmas calories don’t count.
Good things come to those who bake.
It’s the most wine-derful time of the year.
I’m dreaming of a white Christmas, but if the white runs out, I’ll drink the red.
Wine. Better results than mistletoe.
May I have some myrrh hot chocolate?
Simply having a wonderful Christmas thyme.
Let us be merry. (Lettuce be merry.)
Turnip the holiday cheer.
Don’t go bacon my heart this Christmas.
Brie on your best behavior — Santa’s watching.
This ham is practically a mistle-toast to the chef.
Romaine calm, dessert is coming.
Have your elf a s’more-y little Christmas.
What do gingerbread men use to fix their houses? Icing.
What’s a gingerbread man’s favorite drink? Ginger ale.
You’re one smart cookie.
Candy cane you believe it’s Christmas already?
Eggnog-tion is the sincerest form of flattery.
Oh, fudge.
Christmas Carol and Song Puns
Holiday music is already over-the-top cheerful — adding puns takes it further.
Sleigh bells ring, are you listening? No, I’m punning.
Deck the halls with boughs of folly.
Up on the house-top, click click click — there goes my online shopping.
You better watch out, you better not pout — or I’ll post it.
Jingle all the way? I can barely jingle to the couch.
All I want for Christmas is brew. (For coffee lovers.)
Walking in a winter pun-derland.
Feliz Navi-dog. (For dog people.)
We wish you a merry Fishmas. (For seafood fans.)
Silent night, holy pun.
Joy to the swirl. (For ice cream people.)
Have your elf a merry little Christmas.
Bark the herald angels sing. (For dog owners.)
Jingle bell rock-et science.
O come all ye thankful (for the food).
Do you hear what I beer?
Rudolph the red-nosed rein-beer.
Slay ride.
Romantic Christmas Puns
For your partner, your crush, or anyone you want to make smile with something sweet and cheesy.
I love you from head to mistle-toe.
You’re the star on top of my tree.
You make my heart melt faster than a snowman in March.
I only have ice for you.
You’re worth melting for.
You had me at merlot. Merry Christmas.
You make the yuletide gay.
You light up my life like a Christmas tree.
All I want for Christmas is you. No pun. Just true.
I’m snow in love with you.
This Christmas is orna-meant to be.
Yule always be my favorite.
You’re the present I never want to return.
Baby, it’s cold outside — come closer.
You’re my Christmas cookie — sweet, warm, and impossible to have just one.
I’ve got a crush on you. A candy cane crush.
My love for you is like Christmas lights — it just keeps glowing.
Kid-Friendly Christmas Puns
Clean, simple, and easy for little ones to understand and repeat (repeatedly).
What do elves learn in school? The elf-abet!
Why does Santa like to garden? Because he likes to hoe, hoe, hoe!
What do sheep say at Christmas? Fleece Navidad!
What do snowmen eat for lunch? Icebergers!
What falls at the North Pole but never gets hurt? Snow!
Why was the snowman looking through carrots? He was picking his nose!
What do monkeys sing at Christmas? Jungle Bells!
What’s every parent’s favorite Christmas carol? Silent Night.
Knock knock. Who’s there? Holly. Holly who? Holly-days are here again!
Knock knock. Who’s there? Snow. Snow who? Snow use — I forgot my keys!
Knock knock. Who’s there? Mary. Mary who? Mary Christmas!
What do you get when you cross a snowman and a vampire? Frostbite!
Why is Christmas just like a day at the office? You do all the work and the fat guy in the suit gets all the credit.
Office and Work Party Puns
Safe for emails, Slack messages, and that moment when your boss asks everyone to “share something festive.”
Time to wrap up this year’s work.
I’m out of office-ially in holiday mode.
This meeting could’ve been a Christmas card.
My work ethic goes on holiday break before I do.
Yule be hearing from me in January.
Let’s table this discussion — the holiday table, specifically.
Wishing you a profit-able new year.
May your holiday be merrier than your inbox.
The holiday party dress code is business Claus-ual.
Season’s greetings from the person who keeps eating your desk candy.
My New Year’s resolution is the same as my password: impossible to remember.
Pet Christmas Puns
For the pet parents who put antlers on their dogs and elf ears on their cats. You know who you are.
Dog Christmas Puns
Santa Paws is coming to town!
Yappy Holidays!
Happy Pawlidays!
Feliz Navidog!
Dachshund through the snow.
We woof you a Merry Christmas.
Deck the paws with boughs of holly.
Merry Woofmas to all, and to all a good bite.
Have a very furry Christmas.
My dog’s favorite Christmas movie? Santa Buddies, obviously.
Cat Christmas Puns
Meow-ry Christmas!
Happy Mew Year!
Santa Claws is watching.
Whisker wonderland.
It’s beginning to look a lot like Catmas.
Have a purr-fect holiday season.
It’s meow or never for that Christmas photo.
Feline festive.
This cattitude landed me on the naughty list.
My cat knocked over the tree. Again. Merry Clawsmas.
Ugly Christmas Sweater Puns
For sweater party invitations, captions, and the inevitable “why are you wearing that” conversations.
This sweater is snow laughing matter.
My sweater brings all the elves to the yard.
Fleece Navidad.
Sweater weather is better together.
You could say I’m kind of a big knit deal.
I’m all tangled up in the holiday spirit.
This sweater’s uglier than fruitcake. And I love it.
Wool you look at this masterpiece?
I didn’t choose the sweater life. The sweater life chose me.
Knit happens.
How to Actually Use These Puns
Christmas puns are only as good as their delivery. Here’s where each type works best.
Holiday cards and gift tags — Short, standalone puns work best. “Yule be missed” for a farewell card. “That’s a wrap” on a gift tag. “You’re one smart cookie” tucked into a box of homemade cookies. Keep it to one pun per card — stacking multiple puns dilutes the impact.
Instagram and social media captions — Match the pun to the photo. A tree pic gets “Looking good, feeling pine.” A snow scene gets “There’s snow place like home.” A food shot gets “Season’s eatings.” The pun should feel connected to the image, not random.
Holiday emails and office messages — Keep it professional-adjacent. “Wishing you a profit-able new year” works in a client email. “Santa saw your browser history” does not. One pun in the sign-off is enough — don’t turn a work email into a comedy special.
Party icebreakers — Timing matters more than the pun itself. Drop a pun when there’s a natural setup: someone mentions the cold (“Ice to meet you”), a gift gets opened (“That’s a wrap!”), or the tree lights turn on (“Can I get a watt watt?”). Forced delivery kills even the best pun.
Group chats and texts — Rapid-fire puns work here. Send three or four in a row and see who groans first. Group chats are the one context where quantity beats quality.
Frequently Asked Questions
What makes a good Christmas pun?
The best Christmas puns are short, unexpected, and work on two levels at once. “That’s a wrap” works because it means both finishing something and wrapping a gift. The pun should be obvious enough that everyone gets it but clever enough that it earns a reaction. If people groan and smile simultaneously, you’ve hit the sweet spot.
Are these puns appropriate for kids?
Most of them are. The Santa, elf, snowman, reindeer, and tree sections are completely kid-friendly. The office and romantic sections lean more toward adults but contain nothing inappropriate. The food and drink section includes a few wine jokes that are obviously adult-oriented. When in doubt, stick to the animal puns — kids love those.
Can I use these puns in my holiday marketing?
Absolutely. Christmas puns work well in email subject lines (“Yule love our holiday sale”), social media captions, banner ads, and seasonal landing pages. The gift and wrapping puns are particularly useful for ecommerce. Keep it to one pun per piece of content — overdoing it makes your brand look less credible, not more festive.
How many puns should I put in one Christmas card?
One. Maybe two if they’re very short and complement each other. A card with five puns reads like a joke book, not a personal message. Pick the single pun that best matches your relationship with the recipient and let it do the work.
What’s the funniest type of Christmas pun?
That depends entirely on your audience, but elf puns and Santa puns tend to land most consistently because everyone knows the source material. Snow puns work well in captions. Reindeer puns are great for kids. Food puns work at dinner. The funniest pun is always the one that fits the moment — not the cleverest one on paper.
Every website leaves traces across the web — specific phrases, URL structures, and platform signatures that get indexed by search engines. SEO footprints are the search queries that exploit these traces to surface link building opportunities at scale, for free, using nothing more than Google.
A search for “powered by WordPress” + “intitle:travel blog” returns thousands of WordPress travel sites. Add “write for us” and you’ve narrowed it down to travel blogs actively accepting guest contributions. Replace that with “inurl:resources” and you’ve found curated resource pages that link out by design. Layer in “site:.edu” and you’re looking at university resource pages — among the most authoritative link sources on the web.
This guide covers the footprint queries that matter for each link building tactic, how to combine operators for precision, the vetting process that separates good prospects from bad ones, and the complete workflow from search to secured link.
What SEO Footprints Are and How They Work
An SEO footprint is a specific text pattern, URL structure, or platform signature that appears across many websites and gets indexed by Google. Because Google indexes these patterns, you can search for them with targeted queries to find websites that meet specific criteria — sites that accept guest posts, maintain resource pages, run on particular CMS platforms, or discuss topics in your niche.
The core mechanism is Google’s search operators: special commands that modify search behavior. The most important ones for link building:
“exact phrase” — Quotation marks force Google to return only results containing that exact phrase. “Write for us” returns only pages with those three words in that order.
site: — Restricts results to a specific domain or TLD. site:.edu returns only results from educational domains. site:competitor.com returns only pages from that competitor.
intitle: — Finds pages with your term in the page title. intitle:resources narrows results to pages specifically about resources.
inurl: — Finds pages with your term in the URL. inurl:guest-post surfaces pages whose URLs contain “guest-post.”
– (minus sign) — Excludes results containing a term. -site:pinterest.com removes Pinterest from results.
Individual operators are useful. Combined operators are powerful. “Content marketing” + intitle:resources + site:.edu returns educational resource pages specifically about content marketing — a precise, high-value prospect list generated in seconds.
Why Footprints Still Matter in 2026
The link building landscape has shifted significantly. Most site owners now expect payment for guest post placements. Google’s algorithm evaluates your entire digital entity — brand mentions, topical authority, E-E-A-T signals — not just individual backlinks. AI-generated content is everywhere, which means editorial links from credible sites carry more weight than ever.
Footprints remain valuable because they solve the prospecting bottleneck. Finding the right websites to pitch is the most time-consuming part of link building. Paid tools like Ahrefs and Semrush help, but footprints give you a free, flexible, endlessly customizable alternative — and they surface opportunities that tool-based prospecting sometimes misses.
Google’s recent algorithm updates have also elevated user-generated content from Reddit, Quora, and niche forums in search results. Forum links that were dismissed a few years ago now carry more weight, especially from well-moderated, topically relevant communities. Google officially treats nofollow links as “hints” rather than directives, meaning even nofollow links from authoritative forums can influence rankings.
The strategic value of footprints in 2026: they let you find prospects across every major link building tactic — guest posting, resource page insertion, broken link replacement, unlinked brand mentions, niche edits, .edu/.gov outreach, and forum/community engagement — without monthly subscription costs.
Footprints for Guest Post Prospecting
Guest posting remains a core link building tactic, though the bar is higher than it used to be. Quality sites are selective, and the pitch needs to offer genuine value. Footprints help you find sites that explicitly accept contributions.
Core guest post footprints:
“your keyword” + “write for us”
“your keyword” + “guest post guidelines”
“your keyword” + “submit a guest post”
“your keyword” + “become a contributor”
“your keyword” + “contributing writer”
“your keyword” + inurl:guest-post
“your keyword” + intitle:”write for us”
“your keyword” + “guest post by” (finds sites that have already published guest posts)
site:competitor.com “guest post by” — reveals where competitors have guest posted
“competitor name” -site:competitorwebsite.com “guest post” — finds competitor guest posts on other sites
Pro tip: Many high-quality sites no longer advertise “write for us” pages. They accept contributions but don’t use these phrases. For these sites, search for “your keyword” + “contributor” + “LinkedIn” to find authors who contribute to multiple publications, then identify which sites they write for.
Footprints for Resource Page Link Building
Resource pages exist specifically to link out to useful content. They’re curated lists of tools, guides, articles, and references on a topic. Getting listed on a relevant resource page is one of the highest-value, most natural-looking link types available.
.edu and .gov domains carry authority because of their strict registration requirements — you can’t buy these TLDs without proving institutional legitimacy. Their value comes from the inherent trust and authority these institutions hold, which flows through their outbound links. Target their resource pages, library guides, departmental pages, and newsrooms.
Footprints for Unlinked Brand Mention Outreach
Unlinked brand mentions are the lowest-friction link building opportunity available. Someone has already written about your brand, product, or content — they just didn’t add a link. All you need to do is ask.
Core unlinked mention footprints:
“Your Brand Name” -site:yourdomain.com — returns every page mentioning your brand except your own site
“Your Product Name” -site:yourdomain.com -site:facebook.com -site:twitter.com — filters out social media
“Your CEO Name” + “your industry” -site:yourdomain.com — finds mentions of your people
“Your Report/Study Title” -site:yourdomain.com — finds sites that referenced your research without linking
Conversion rates on unlinked mention outreach consistently exceed other methods because you’re asking for a minor edit (adding a link) rather than new content creation. The author already chose to mention you — the link is a natural next step.
The workflow: Run the search, export results, cross-reference against your actual backlink profile (in Ahrefs or Semrush) to confirm which mentions lack links, then reach out with a simple, specific request.
Footprints for Broken Link Building
Broken link building involves finding dead links on relevant websites and offering your content as a replacement. The value proposition for the webmaster is clear: you’re helping them fix a problem on their site. The conversion rate is higher than cold outreach because you’re providing a service, not just asking for a favor.
How to find resource pages with potential broken links:
“your keyword” + intitle:resources + inurl:links
“your keyword” + “useful resources” + “updated”
site:.edu + “resources” + “your topic” (educational sites are notorious for dead links)
Once you find resource pages, use a browser extension like Checkmylinks or Ahrefs’ broken link checker to scan for dead links. When you find a broken link to a resource similar to yours, contact the webmaster: “I noticed the link to (dead resource) on your (page) is broken. We have a similar resource at (your URL) that might be a good replacement.”
Footprints for Competitor Backlink Analysis
Your competitors’ link profiles are a roadmap of sites willing to link in your niche. If a site linked to your competitor, it may link to you — especially if you can offer something better.
Core competitor analysis footprints:
site:competitor.com intitle:”your keyword” — find their top content on your target topics
“competitor brand name” + “alternatives” — find comparison content (where you could be listed)
link:competitor.com (partially deprecated but still returns some results in some search engines)
For deeper analysis, export competitors’ backlink profiles from Ahrefs or Semrush, filter by DR 30+, dofollow, and organic traffic 1,000+, then identify patterns: which sites link to them? What content earned those links? Can you create something better and pitch the same sites?
Footprints for Forums and Community Link Building
Google has elevated Reddit, Quora, and niche forums in search results. Strategic, genuine participation in these communities builds both links and brand presence.
Forum-finding footprints:
“your keyword” + “forum”
“your keyword” + “discussion board”
“your keyword” + inurl:forum
“your keyword” + “Powered by vBulletin”
“your keyword” + “Powered by phpBB”
“your keyword” + “Powered by Discourse”
“your keyword” + “Powered by XenForo”
Quality signals to look for: Active discussions from the last 30 days, multiple replies per thread, over 1,000 registered members, strict moderation policies, and categories that match your niche.
Important: Forum link building requires genuine participation. Answer questions, share expertise, and build credibility before sharing any links. Drop-and-run link spam triggers moderation filters and damages your reputation. The best forum links come from threads where your content genuinely answers someone’s question.
Cleaning Your Results: Negative Footprints
Raw footprint searches produce noise. Filtering out low-quality results is as important as finding the right ones.
Essential exclusion operators:
-inurl:sites.google.com (removes low-quality Google Sites)
-inurl:medium.com (removes Medium, unless you specifically want it)
-site:pinterest.com (removes Pinterest)
-site:quora.com (removes Quora, unless targeting it specifically)
Freshness filter: Use Google’s Tools menu and select “Past year” to ensure results come from active, maintained sites. A site that hasn’t published in 18 months is unlikely to respond to outreach.
Geo-targeting by TLD: If targeting specific markets, append the country TLD: “your keyword” + “write for us” + site:.co.uk (UK only), site:.com.au (Australia only).
The Prospect Vetting Workflow
Finding prospects is step one. Vetting them determines whether your outreach effort is worth the time.
Step 1: Domain authority check. Use Ahrefs, Semrush, or Moz’s free toolbar to check DR/DA. For most campaigns, filter for DR 30+. Sites below DR 20 rarely provide meaningful SEO value unless they have strong niche relevance and real traffic.
Step 2: Organic traffic check. A site can have high DA but zero traffic (expired domain, PBN, or abandoned site). Check organic traffic estimates in Ahrefs or Semrush. Sites with under 500 monthly organic visitors are low priority.
Step 3: Spam score check. Moz’s spam score or Ahrefs’ domain health metrics help identify sites with unnatural link profiles. Keep spam score below 5%.
Step 4: Content quality and freshness. Visit the site. Is content original or syndicated? Are posts published regularly (at least monthly)? Does the site look maintained? Sites with irregular updates may go offline, taking your link with them.
Step 5: Link profile check. Does the site add dofollow external links in content? Some sites nofollow all outbound links — your link won’t pass equity. Use Checkmylinks to quickly scan a few pages.
Step 6: Contact information. Is there an about page, contact form, or editor email? If you can’t find a way to reach the site owner, the prospect is a dead end.
Output: A qualified list of 50-100 prospects, organized by priority (DR, relevance, estimated response likelihood), ready for outreach.
Tools That Complement Footprint Prospecting
Footprints are free. But combining them with the right tools multiplies their effectiveness.
Free tools:
Google Alerts — set alerts for your footprint queries to catch new opportunities as they’re indexed
Checkmylinks (Chrome extension) — scans any page for broken links
Hunter.io (free tier) — find email addresses for outreach
Ahrefs Webmaster Tools (free) — basic backlink analysis for your own domain
Google Search Console — monitor your existing backlinks and track new ones
Mid-tier tools:
Screaming Frog (free up to 500 URLs) — crawl prospect sites for broken links and link structure
ScrapeBox — harvest thousands of URLs based on footprint queries (power-user tool)
Premium tools:
Ahrefs — competitor backlink analysis, Content Explorer for finding link-worthy content, broken link finder
Semrush — backlink gap analysis, link building tool with outreach management
BuzzStream — outreach CRM for managing prospect lists and email campaigns
Pitchbox — automated prospecting with built-in footprint searches and outreach sequences
You don’t need all of these. A practitioner with Google, Hunter.io, and Checkmylinks can run effective footprint-based campaigns. Ahrefs or Semrush accelerates the process significantly for competitor analysis and prospect vetting.
From Footprint to Link: The Complete Workflow
Choose your tactic. Guest post, resource page, broken link, unlinked mention, or niche edit. Each tactic uses different footprints and different outreach angles.
Run 5-10 footprint queries per tactic. Export results to a spreadsheet. For a guest post campaign, run all the guest post footprints listed above with your target keyword. Aim for 200+ raw results.
De-duplicate and filter. Remove duplicates, apply negative footprints to clean out low-quality results, filter by freshness.
Vet prospects. Apply the vetting workflow: DR 30+, organic traffic 500+, spam score below 5%, active publishing, dofollow links, findable contact info. Your 200 raw results will typically narrow to 40-80 qualified prospects.
Find contact details. Use Hunter.io, LinkedIn, or the site’s contact/about page. Find the specific person (editor, content manager, webmaster) — not a generic info@ address.
Write personalized outreach. Reference something specific on their site. State your value proposition clearly. For guest posts: pitch a specific topic with an outline. For resource pages: explain why your resource belongs on their list. For broken links: identify the broken link and offer your replacement. For unlinked mentions: a simple, friendly ask to add the link.
Follow up. One follow-up after 5-7 days if no response. Keep it brief. Most links are secured on the follow-up, not the initial email.
Track everything. Log every prospect, every outreach, every response, every link secured. The data from 100 outreach emails teaches you which footprints, which niches, and which outreach angles produce the best conversion rates for your specific situation.
Footprint-based link building is a skill that compounds. The more queries you run, the better you get at spotting patterns, and the more custom footprint combinations you develop for your niche. Start with the basic footprints, add complexity as your confidence grows, and let the results guide your strategy.
Are your ad campaigns burning through budget without delivering results? Learning about negative keywords might be the solution you’ve been overlooking.
Negative keywords act as vital filters for your ad campaigns and prevent your ads from appearing in irrelevant searches. Good keywords bring visitors to your site, and understanding negative keywords in Google Ads will make that traffic actually valuable. Your campaigns become more focused by assigning these negative terms, which target only the search queries relevant to your products or services.
The right implementation of negative keywords helps refine your targeting and improve critical metrics like click-through rates and conversion rates. You have three different match type options—broad match, phrase match, and exact match—each playing unique roles in your keyword strategy.
This piece walks you through everything you need to know about finding and implementing negative keywords to stop wasting your ad budget on the wrong audience.
What Are Negative Keywords and Why They Matter
Negative keywords are a powerful filtering tool in your PPC arsenal. They work differently from standard keywords. While standard keywords make your ads appear, negative keywords stop them from showing up when users search for certain terms. They act as gatekeepers and make sure your ads reach only the right audience.
How negative keywords work in PPC
Negative keywords do the opposite of what standard keywords do in paid search campaigns. They tell ad platforms to hide your ads when specific search terms appear. Let’s say you sell premium watches. You might add “cheap” as a negative keyword. This way, your ads won’t show up when someone looks for “cheap watches”.
This filtering system works at three different levels in your campaign structure:
Account-level negative keywords affect all campaigns in your account
Campaign-level negative keywords affect all ad groups in a specific campaign
Ad group-level negative keywords affect only specific ad groups
Negative keywords can change your campaign results by a lot. Research shows that campaigns without negative keywords waste up to 90% of ad spend on clicks that don’t matter. Your Quality Score goes up when you use negative keywords well. This leads to lower cost-per-click and better ad positions.
Google Ads and other platforms give you three types of negative keyword matches:
Negative broad match (default setting): Keeps out searches that have all your negative keyword terms in any order
Negative phrase match: Stops ads when searches have the exact keyword phrase, even in longer searches
Negative exact match: Blocks ads only for searches that match the term exactly
Difference between standard and negative keywords
Standard and negative keywords serve different purposes. Standard keywords (also called positive keywords) make your ads show up. Negative keywords keep them hidden.
Here’s a real example: A furniture store might use “modern sofa” as a standard keyword to attract buyers. At the same time, they might use “cheap” as a negative keyword. This stops their ads from showing up in searches like “cheap modern sofa”. This helps premium furniture ads reach people who care about quality.
Standard keywords bring in relevant searches. Negative keywords keep out irrelevant ones. Both help optimize campaigns, but they work in opposite ways.
These keyword types handle variations differently:
Standard keywords match synonyms, misspellings, and similar terms
Negative keywords need manual addition of variations to exclude them
Using negative keywords smartly gives you many benefits:
Saves money for valuable clicks
Makes ads more relevant and gets better click-through rates
Makes Quality Score better
Reduces cost-per-click
Gets more conversions
Smart use of negative keywords turns your PPC campaigns from broad marketing efforts into precise tools that connect with your ideal audience.
Understanding Negative Keyword Match Types
Knowing which negative keywords to add is just as vital as understanding their correct application. Each negative keyword match type filters out unwanted traffic differently and acts as a customizable barrier between your ads and irrelevant searches.
Broad match explained
Broad match is the default setting for negative keywords and casts the widest net among all match types. Your ad won’t appear for searches that contain all the words in your negative keyword—whatever their order in the search query.
To name just one example, see what happens when you add “shoulder bags” as a negative broad match keyword. Your ads won’t show for:
“shoulder bags”
“bags shoulder” (words in different order)
“red shoulder bags” (additional words included)
Your ads might still appear for “shoulder bag” (singular form) because broad match negatives don’t automatically include variations like plurals or similar terms. This is a significant difference—unlike positive broad match keywords, negative broad match keywords don’t extend to synonyms or close variants.
Phrase match explained
Negative phrase match gives you more precision. It prevents your ads from showing when searches contain your exact keyword phrase in the same order, even with additional words before or after it.
A good example shows how “running shoes” works as a negative phrase match keyword:
Your ads won’t show for “best running shoes” or “running shoes on sale”
Your ads will still appear for “shoes for running” or “running shoe stores” (different order)
This match type strikes a balance between broad match’s flexibility and exact match’s precision. You need to enclose your negative phrase match keywords in quotation marks (“keyword”) when adding them to your campaigns.
Exact match explained
Negative exact match takes the most focused approach. It blocks your ads only when someone searches for the precise keyword—nothing more, nothing less. Let’s say you use [shoulder bags] as a negative exact match:
Your ads won’t appear for “shoulder bags”
Your ads will still show for “red shoulder bags” or “shoulder bags for men”
Square brackets [keyword] are needed to implement exact match negative keywords. This match type prevents the least amount of potential traffic compared to other match types.
When to use each match type
The right match type depends on your campaign goals and target keywords:
Use negative broad match to aggressively block terms that are nowhere near relevant to your business. This match type restricts the most traffic, so use it carefully to avoid blocking valuable leads.
Use negative phrase match to exclude specific phrases while keeping flexibility. This works best when certain word combinations don’t fit, yet the individual words might bring value in other contexts.
Use negative exact match to precisely block specific search terms without affecting related searches. This match type helps especially when you have highly targeted campaigns that need detailed control.
Note that no single match type works best for all situations. The core team of experienced advertisers suggests adding the least amount of negative keywords possible. This makes campaign management easier and simplifies your account structure.
A good rule of thumb: if you have a limited budget, more restrictive match types (broad and phrase) usually give better returns by keeping your ads away from irrelevant audiences.
How to Find Negative Keywords in Google Ads
You need to analyze your campaign information to find negative keywords. Google Ads gives you several effective ways to find search terms that waste your budget. These terms should be excluded from your campaigns.
Use the search terms report
The Search Terms Report is the best tool to find negative keywords. Here’s how you can access this report:
Log into your Google Ads account
Go to the Keywords tab in the left menu
Click on “Search Terms” in the submenu
Adjust the date range as needed
This report shows you the actual queries that triggered your ads. You’ll see impressions, clicks, and conversion metrics. It’s a goldmine to find potential additions to your negative keyword lists. Recent changes mean advertisers can only see about 50-70% of search terms that trigger ads. This makes regular monitoring crucial.
Identify irrelevant queries
Start your Search Terms Report review by looking for searches that don’t match your business goals:
Search for terms unrelated to your products or services
Find industry jargon that doesn’t fit your offerings
Look for competitor’s brand names that might trigger your ads
Adam Gorecki from Intigress says: “If you don’t have time to review everything, start with the search terms getting the most impressions—then move on to the ones costing you the most”. This helps you tackle high-volume irrelevant terms first.
Look for low-converting terms
Look beyond the obvious irrelevant terms. Watch for relevant-looking searches that don’t perform well:
Terms that get many impressions but few conversions
Queries with high click-through rates but low conversion rates
Keywords that cost more than your profitability threshold
The process becomes easier with filters in your Search Terms Report. The funnel icon lets you filter by metrics like CTR, conversion rate, or cost per action. These filters help you spot search terms that cost money without results. Such terms make perfect candidates for your negative keyword list.
Use keyword research tools
Several tools can help you find more negative keywords beyond Google Ads:
Google Keyword Planner shows potentially irrelevant variations
Third-party keyword research tools find related terms to exclude
Negative keyword finder tools spot non-performing queries automatically
Duane Brown from Take Some Risk Inc. suggests “using synonym finder tools to identify closely related terms to add to your negative keyword lists”. AI tools now help score search terms by relevance. This makes it easier to spot low-relevance queries you should exclude.
A quick 30-minute weekly review of your negative keyword lists can make your campaigns perform better over time. This ongoing process needs your regular attention.
How to Add Negative Keywords to Your Campaigns
The right placement of negative keywords in your Google Ads account will maximize their effectiveness. Your campaign performance can improve dramatically when you implement them at the appropriate level to prevent wasted ad spend.
Account-level vs campaign-level vs ad group-level
Your advertising strategy benefits from each negative keyword level in distinct ways:
Account-level negatives work across all campaigns. They excel at blocking broad, irrelevant terms that never bring qualified leads. Terms like “free,” “jobs,” “careers,” or “tutorial” make good candidates. The account level has a limit of 1,000 negative keywords.
Campaign-level negatives affect all ad groups within a specific campaign. They work best to arrange exclusions with campaign-specific goals—such as separating brand from non-brand traffic or blocking regional variations.
Ad group-level negatives give you the most precise control. They help maintain focused targeting and prevent ad groups from competing with each other.
Steps to add negative keywords in Google Ads
Here’s how to add negative keywords to your account:
For account-level negatives:
Click the Admin icon in your Google Ads account
Select “Account settings”
Expand the “Negative keywords” section
Click the plus button and enter your terms (one per line)
Click Save
For campaign-level negatives:
Go to Keywords > Negative Keywords
Click the blue “+” button
Select the campaign you want to modify
Enter your negative keywords
Choose the appropriate match type
For ad group-level negatives:
Follow the same steps as campaign-level, except select specific ad groups instead
Shared negative keyword lists can help you apply common exclusions across multiple campaigns efficiently.
Avoiding keyword overlap issues
Keyword conflicts happen when negative keywords block your targeted keywords from triggering ads. These tips will help prevent such issues:
Regular audits of your negative keyword lists prevent over-filtering
Watch for “negative keyword conflicts” notifications in Google Ads
Use Google’s “Remove conflicting negative keywords” recommendations
Track changes in impression share that might signal blocking problems
Match type selection matters—broader match types block more traffic
A clean negative keyword structure needs clear naming conventions like “NEG_Master_Junk” or “NEG_Brand_Protection”. Schedule quarterly reviews to keep your negative keyword strategy fresh.
Tips to Optimize and Maintain Your Negative Keyword List
You need to pay constant attention to negative keyword management and keep refining your strategy. Your campaigns might waste up to 40% of their ad spend on terms that never convert if you don’t maintain them properly.
Review search terms regularly
Your campaign success depends on how well you check your search term reports. Take time each month to get into your reports. Pay special attention to terms that get the most impressions or cost you the most money. Look for patterns in queries that don’t work instead of focusing on single terms. This method helps you save money more effectively. You should check more often during seasonal changes or when you launch new products. This helps you catch irrelevant terms before they affect your results.
Use negative keyword lists
A shared negative keyword list helps you manage your account better by blocking terms across multiple campaigns at once. Google Ads lets you add up to 5,000 negative keywords per list with a maximum of 20 lists in your account. You might want to organize your lists by themes:
Universal negatives (free, cheap, DIY)
Brand terms (to block from non-brand campaigns)
Competitor terms
Job/career related terms
Make sure the keywords in your negative lists don’t clash with terms you want to bid on. This stops you from blocking traffic you actually want.
Avoid over-filtering
Too many negative keywords can limit your campaign’s reach unexpectedly. Research shows that aggressive filtering can block searches that might make you money and limit the data you need to improve. Yes, it is tricky to balance filtering out bad clicks while keeping enough traffic flowing. This needs constant testing and tweaking. Start with small batches of negatives rather than big uploads. This makes it easier to spot which blocks affect your performance.
Make use of automation tools
AI-driven automation improves negative keyword management by a lot. These tools check your account daily and automatically add underperforming search terms as negatives. The systems analyze immediate data to spot irrelevant keywords before people click your ads. Businesses that use these tools usually see 15-30% fewer irrelevant clicks. In spite of that, you should watch over automated systems by checking which terms they add and why. This way, you won’t accidentally block valuable traffic.
Conclusion
Negative keywords are among the most powerful tools in your PPC arsenal, yet marketers rarely tap into their full potential. You’ve learned how these strategic filters stop your ads from showing up in irrelevant searches and prevent wasted budget before it happens.
The work to find and implement negative keywords takes consistent effort. However, the results make it all worthwhile. Your campaigns get more focused, your click-through rates improve, and you end up seeing higher conversion rates as you connect with prospects who actually care.
Building your negative keyword strategy requires a clear understanding of broad, phrase, and exact match types. Each match type serves a specific purpose – from filtering out completely irrelevant terms to blocking specific queries. Your campaign goals and target audience will determine which match type works best.
You just need to manage your negative keywords regularly. Take time each week or month to check your search term reports. Look for patterns of irrelevant traffic and update your negative keyword lists. This process gets easier with practice and delivers better results over time.
Managing multiple campaigns becomes simpler with shared negative keyword lists. You can apply consistent exclusions across your account without doing the same work twice. These lists, along with some automation, help streamline your workflow while you retain control over where your ads appear.
Once you put a solid negative keyword strategy in place, you’ll see quick improvements in your campaign metrics. Your ad spend targets only searches that could convert, which helps your budget work harder and deliver stronger results.
The sort of thing I love about negative keywords is how they work behind the scenes in PPC advertising. When you research, implement, and manage them properly, they change scattered ad campaigns into precision marketing tools that connect you directly with your ideal customers.
FAQs
Q1. How do I find negative keywords for my Google Ads campaigns? Use the Search Terms Report in Google Ads to identify irrelevant queries triggering your ads. Look for terms with high impressions but low conversions, and consider using keyword research tools to discover potential negative keywords.
Q2. What are the different types of negative keyword match types? There are three negative keyword match types: broad match (excludes searches containing all words in any order), phrase match (blocks searches with the exact phrase), and exact match (prevents ads from showing for the precise keyword only).
Q3. How often should I review and update my negative keyword list? It’s recommended to review your search term reports and update your negative keyword list at least monthly. During seasonal changes or new product launches, increase the frequency to catch emerging irrelevant terms quickly.
Q4. Can I apply negative keywords across multiple campaigns? Yes, you can create shared negative keyword lists in Google Ads. These lists can be applied to multiple campaigns simultaneously, streamlining account management and ensuring consistent exclusions across your account.
Q5. How do I avoid over-filtering with negative keywords? Start by adding negative keywords in small batches rather than large uploads. Regularly monitor your campaign’s performance and impression share to ensure you’re not accidentally blocking valuable traffic. Use automation tools cautiously and always review automated additions to your negative keyword list.
A good SEO keyword research tool can reshape the scene of your online presence. These tools have helped me grow blogs to over 100K monthly visitors and generate more than eight figures in revenue for clients. The results aren’t just impressive—they’re transformative for businesses.
Your website’s success depends heavily on keyword research. It’s the classic case where 20% of your work drives 80% of the results. My experience with multiple clients and evaluation of nearly 90 different keyword research tools has taught me something crucial. The right keyword research tool isn’t just helpful—it’s vital to success. The gap between average and excellent keyword research tools often determines whether your content ranks or vanishes into the digital void.
This detailed comparison covers the 15 best SEO keyword research tools for 2026. You’ll find everything from free SEO keyword research tools to premium options. The information here will help you choose the perfect tool that matches your strategy and budget, regardless of your experience level.
Google Keyword Planner serves as Google’s core keyword research tool. While designed for advertisers, SEO professionals have widely adopted it. This free tool helps users find keywords, analyze search volumes, and refine marketing strategies even without running ad campaigns.
Google Keyword Planner key features
Google Keyword Planner comes packed with several powerful features for keyword research:
Keyword discovery – Find new keyword ideas related to your business or website content
Search volume data – See average monthly searches in the last 12 months
Location targeting – Filter results by countries, states, or zip codes
Historical data – Check search trends up to 4 years back
Mobile vs. desktop split – Get separate volume data for different devices
Keyword forecasting – Calculate potential traffic based on bid amounts
Google Keyword Planner pros and cons
Pros:
Delivers hyper-local search volume data perfect for location-based businesses
Free to use with some limitations for non-advertisers
Provides data straight from Google’s servers
Targets locations down to specific zip codes
Cons:
Shows broad search volume ranges (1K-10K) unless you run active ads
Lacks organic SEO keyword difficulty metrics since competition metrics focus on PPC
Averages 12 months of search data without detailed trends
No SERP features analysis or competitor insights
Google Keyword Planner pricing
The tool remains completely free. You need a Google Ads account and billing information to use it, but spending money isn’t required. Running active Google Ads campaigns lets you see exact search volumes instead of ranges.
Google Keyword Planner best use case
Google Keyword Planner excels especially when you have:
Early-stage keyword brainstorming needs before deeper analysis
Local businesses that need location-specific search data
Other SEO tools to cross-reference data
PPC campaign planning and budget forecasting needs
Active Google Ads campaigns for full data access
The tool’s direct access to Google’s data makes it a valuable part of any keyword research toolkit, in spite of its limitations.
Google Autocomplete packs surprising keyword research power right in the search box. This smart feature suggests searches as you type, based on what millions of people are searching for.
Google Autocomplete key features
Google Autocomplete makes searching easier through these key capabilities:
Up-to-the-minute data analysis that reflects popular search patterns and trending topics
Location-based suggestions that match your area
Individual-specific experiences from your search history (when logged in)
Multi-device functionality on desktop, mobile, and other Google properties
Continuous refinement with each keystroke
Google’s data shows users save 25% of their typing time with this feature. The daily cumulative saving adds up to over 200 years of typing time.
Google Autocomplete pros and cons
Pros:
Quick access to popular search queries without extra tools
Shows how people actually search and ask questions
Helps with local SEO through area-specific keyword insights
Lets you see competitor comparisons through “brand name vs” searches
No cost to use
Cons:
Dedicated keyword tools give more options
No metrics for search volume or competition
Your search history can affect results
You need to type each query manually
Shows only popular predictions (usually 5-10 suggestions)
Google Autocomplete pricing
The standard Google search interface includes Google Autocomplete at no cost. Developers building with Google Places Autocomplete API pay as they go after using the $200 monthly credit.
Google Autocomplete best use case
Google Autocomplete works great as an extra keyword research tool to:
Ahrefs stands as a game-changer among SEO keyword research tools and has one of the largest backlink databases worldwide. My experience shows Ahrefs is essential for keyword research and competitor analysis.
Ahrefs key features
The life-blood of Ahrefs is its impressive Keywords Explorer tool. It generates thousands of keyword ideas from a database of 28.7 billion keywords filtered from 110 billion found in total. On top of that, it provides:
Site Explorer – Analyzes competitor backlinks, organic search traffic, and reveals gaps you can use
Keyword Difficulty (KD) – Estimates ranking difficulty based on the number of backlinks to top-ranking pages
Traffic Potential – Shows how much traffic the #1 ranking page gets for your keyword
Rank Tracker – Monitors your rankings across 190+ countries on both desktop and mobile
Content Explorer – Finds high-performing content in your niche
Ahrefs pros and cons
Pros:
The most important backlink data for detailed link analysis
Easy-to-use interface that makes complex data available
Accurate keyword difficulty scores help you set priorities
Parent Topic feature helps you target broader topics while ranking for specific keywords
Instant keyword clustering saves research time
Cons:
No free plan or trial (only limited free tools)
Nowhere near affordable for beginners and small businesses
Credit-based system on lower plans limits usage
Shows data only for Google (not other search engines like YouTube or Bing)
Content Explorer might not be crucial for non-content-heavy strategies
Ahrefs pricing
Ahrefs has four primary subscription plans:
Lite – USD 129.00/month with 5 projects and 750 tracked keywords
Standard – USD 249.00/month with 20 projects and 2,000 keywords
Advanced – USD 449.00/month with 50 projects and 5,000 keywords
Semrush stands out as the gold standard for digital marketing professionals. It offers a detailed suite of over 50 tools that cover SEO, content marketing, keyword research, PPC, and social media marketing. While other platforms limit themselves to SEO, Semrush delivers complete solutions for online visibility.
Semrush key features
The platform’s keyword research capabilities shine with:
Keyword Overview – Shows key metrics for any keyword including search volume, difficulty, CPC, intent, and trends
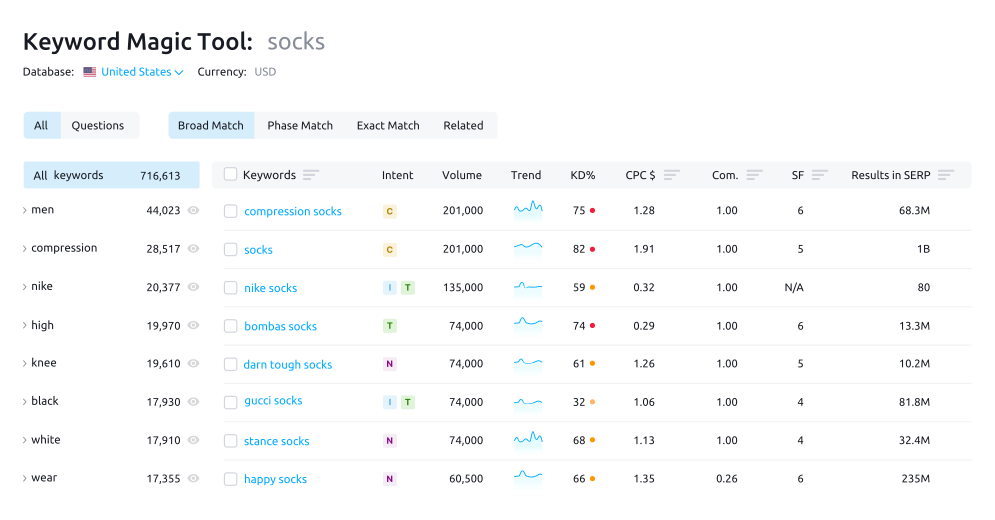
Keyword Magic Tool – Reveals related terms from a database of over 27 billion keywords
The platform also includes powerful competitor analysis tools and backlink monitoring with over 43 trillion backlinks indexed. Its detailed site audits check more than 140 technical issues.
Semrush pros and cons
Pros:
The market’s largest keyword database with over 25.7 billion keywords
A complete toolkit that covers all digital marketing channels
Rich backlink metrics with toxicity scores and quality ratings
AI visibility tracking for ChatGPT, Google AI, and Perplexity
Daily rank tracking updates while competitors offer weekly updates
Cons:
New users might find the interface overwhelming due to many features
Traffic estimates sometimes lack accuracy
Data covers only Google (no YouTube or Bing)
Higher price point than similar tools
Standard plans limit you to one user with extra costs for additional users
Semrush pricing
The platform offers flexible toolkit-based pricing:
SEO Pro Plan – USD 139.95/month includes 500 tracked keywords
SEO Guru Plan – USD 249.95/month includes 1,500 keywords
SEO Business Plan – USD 499.95/month includes 5,000 keywords
Semrush One – Starts at USD 165.17/month and combines SEO with AI visibility tracking
Users can add other toolkits based on their needs to any subscription.
Semrush best use case
Semrush works best for:
Marketing teams that need analytics across multiple channels
Agencies with multiple clients who require detailed reports
E-commerce businesses that balance organic and paid strategies
Content marketers who want AI-powered content optimization
Brands that care about visibility in traditional and AI search results
Ubersuggest started as a simple keyword suggestion tool but has reshaped the scene since Neil Patel acquired it in 2017. This cost-effective keyword research tool helps users navigate SEO efficiently without complex features getting in the way.
Ubersuggest key features
Ubersuggest combines several practical SEO tools in one package:
Keyword research with volume, difficulty, and CPC data
Site audit tool that spots technical SEO problems and suggests practical fixes
Backlink analysis showing total backlinks, referring domains, and anchor text distribution
Traffic analyzer to track performance and learn about competitors
Rank tracking to monitor keyword positions
AI writer that creates content in 63 languages with export options
Chrome extension giving quick SEO insights right in your browser
Ubersuggest pros and cons
Pros:
Plans start at just USD 29.00 monthly – great value for money
Lifetime payment option sets it apart
Clean, accessible interface works well for beginners
Free version lets you do 3 searches daily
Content marketers get useful ideas and suggestions
Cons:
Keyword database is smaller than premium tools
Backlink analysis lacks depth compared to specialized tools
KWFinder stands out among keyword research tools as a specialized solution that helps you find long-tail keywords with minimal competition. This tool is part of the Mangools SEO suite and provides a quick way to discover ranking opportunities your competitors might overlook.
KWFinder key features
KWFinder comes with several powerful capabilities:
Accurate keyword difficulty scoring on a 0-100 scale to identify low-competition opportunities
Location-specific targeting with support for over 50,000 locations worldwide
SERP analysis with metrics like domain authority and page authority
Keyword lists for organizing research by topic or campaign
Bulk keyword import supporting up to 700 keywords per import
KWFinder pros and cons
Pros:
Easy-to-use interface that beginners love
Accurate keyword difficulty scores help you spot ranking opportunities
Rich local keyword research capabilities
Clean, visual data presentation with clear color-coding
Access to a complete SEO toolkit with backlink analysis and rank tracking
Cons:
Daily search limits on all plans (ranging from 100-1200 searches per 24 hours)
Smaller keyword database compared to enterprise platforms
Limited competitive analysis features
No free version (only a 10-day trial available)
KWFinder pricing
KWFinder’s pricing structure includes three tiers with annual discounts:
Basic: USD 29.90/month annually or USD 49.00 monthly
Premium: USD 39.90/month annually or USD 69.00 monthly
Agency: USD 79.90/month annually or USD 129.00 monthly
Each plan gives you access to the entire Mangools suite of five SEO tools.
KWFinder best use case
KWFinder works best for bloggers, small businesses, and content creators who need low-competition keywords. The tool proves particularly valuable for:
Local businesses that target specific geographic areas
Content creators who want simple keyword research without complexity
SEO beginners who need clear visual difficulty scoring
Marketers who want quick insights without data overload
The tool balances simplicity and functionality perfectly. You’ll find it especially helpful if you need quick keyword research without the steep learning curve of enterprise platforms.
AlsoAsked specializes in extracting and visualizing “People Also Ask” (PAA) data directly from Google search results. The tool helps content creators uncover valuable question patterns and semantic relationships between topics.
AlsoAsked key features
AlsoAsked delivers several specialized capabilities:
Live search data providing timely, up-to-date information
Topical graphs/webs displaying related subtopics and common questions
Location-based search for targeting local or international audiences
Deep search offering expanded topic hierarchies (on higher plans)
Data export options including PNG and CSV formats
Bulk search allowing uploads of up to 1,000 queries at once
API access for programmatic integration
AlsoAsked pros and cons
Pros:
Visual-first approach with interactive mind maps
Access to live PAA data for current search trends
City-level search capabilities
Unlimited users on all plans
Cons:
CSV exports only available on Lite plan (USD 29.00/month) or higher
Credit-based system limiting searches
No keyword clustering tools
No search volume or competition metrics
AlsoAsked pricing
AlsoAsked offers three subscription tiers:
Basic – USD 15.00/month for 100 credits, 24-hour search history
Lite – USD 29.00/month for 300 credits, deep search, CSV exports
Pro – USD 59.00/month for 1,000 credits, API access, bulk searches
AlsoAsked best use case
AlsoAsked excels at helping content marketing teams streamline their efforts based on real user questions. Small business owners managing website content and freelance SEO consultants find it particularly valuable for content ideation.
Answer Socrates is a specialized SEO keyword research tool that helps you find actual questions people ask on Google. A group of marketers built it because they weren’t happy with existing tools. The tool excels at finding question-based content opportunities that other tools miss.
Seneca Plan: USD 29.00/month with 500 searches/month
Aurelius Plan: USD 49.00/month with unlimited searches
Answer Socrates best use case
Content creators who need solid keyword strategies will love Answer Socrates. The tool’s clustering and question discovery features make it perfect for bloggers, SEO specialists, and small businesses that want to address user intent effectively.
Clearscope is a content-first SEO platform that helps optimize written content based on what ranks in search engines. This tool excels with its up-to-the-minute content grading system that helps writers match search intent accurately.
Clearscope key features
Clearscope’s platform comes with several strong capabilities:
Content Reports that analyze top-ranking pages with term recommendations
Up-to-the-minute content grading with letter-based scoring
Topic Exploration to find keywords
Content Monitoring to track performance and suggest updates
Smooth integrations with Google Docs, WordPress and Microsoft Word
Clearscope pros and cons
Pros:
Easy-to-use interface that needs minimal training
Immediate feedback during content creation
Reliable integration options with popular writing platforms
Excellent customer support across all plan tiers
Cons:
Higher cost for smaller teams
Credit-based reporting system limits usage
Lacks backlink analysis or technical SEO features
Basic collaboration tools compared to competitors
Clearscope pricing
Clearscope has three main plans:
Essentials: USD 129.00/month with 20 AI tracked topics
Business: USD 399.00/month with 50 AI tracked topics
Enterprise: Custom pricing with additional features like SSO and crawler whitelisting
Clearscope best use case
Clearscope works best for content marketing teams that need analytical insights for optimization. The platform shines especially when you have enterprise content teams, agencies with multiple clients, and organizations that create highly optimized content at scale.
Surfer stands out as a complete content optimization platform that helps users create, optimize, and rank better in search results. This evidence-based tool analyzes over 500 web signals to provide live optimization guidance while you write.
Surfer key features
The Content Editor sits at the platform’s core. It delivers live optimization feedback through its proprietary Content Score metric, showing a 0.28 correlation with Google rankings. The platform includes several powerful features:
The Topical Map tool builds content authority across entire niches.
Auto-Optimize functionality enhances drafts by adding missing terms and filling content gaps.
AI Tracker keeps tabs on visibility in emerging AI search platforms like ChatGPT, Perplexity, and Google’s AI Overviews.
Internal linking suggestions strengthen site structure using Google Search Console data.
Surfer pros and cons
Pros:
Content Score updates live with immediate feedback
Detailed analysis of top-ranking pages
Seamless integration with Google Docs, WordPress, and other platforms
AI-generated content capabilities with Surfer AI
Content audit features highlight underperforming pages
Cons:
Recent updates get pricey with AI add-ons
User interface becomes complex with added features
Over-optimization might lead to keyword stuffing
Advanced features need significant learning time
Surfer pricing
The platform comes with three main plans:
Essential: USD 99.00/month or USD 79.00/month annually
Scale: USD 219.00/month or USD 175.00/month annually
Enterprise: Custom pricing with extra features
Surfer AI articles start at USD 19.00 each, with discounts available for bulk purchases.
Surfer best use case
Content marketers looking for evidence-based optimization will find Surfer particularly valuable. Users experienced an average 205% increase in clicks within a year, while top performers achieved 312% growth. SEO teams, agencies, and businesses focused on creating optimized content through competitor analysis will benefit most from this platform.
Google Trends turns search data into visual insights that show what people around the world search for on Google and YouTube. This visual keyword research tool shows relative search popularity instead of absolute numbers. The tool helps you spot emerging patterns.
Google Trends key features
Google Trends gives SEO professionals several powerful capabilities:
Immediate data tracking shows search interest changes as they happen
Geographic breakdowns go down to city level for targeted regional analysis
You can compare up to five different search terms at once
Data goes back to 2004 to help you spot long-term patterns
User-friendly, interactive graphs make trend visualization easy
Related topics and queries suggestions show semantic connections
Google Trends pros and cons
Pros:
Completely free access with no account required
Direct data from Google’s search index
Immediate trending search detection
Excellent seasonal pattern identification
Cons:
Shows relative popularity (0-100 scale) instead of actual search volumes
Limited in-depth analysis compared to premium tools
Filters certain searches including low-volume queries and duplicate searches
Google Trends pricing
Google Trends remains entirely free to use, with no paid tiers or subscription options.
Google Trends best use case
Google Trends excels at spotting seasonal patterns, geographical interest variations, and emerging topics. The tool works great for content planning around cyclical trends, competitor comparisons, and helps you find rising topics before they peak in popularity.
Keywords Everywhere serves as a browser extension compatible with Chrome, Firefox, and Edge. The tool shows SEO data right in your search results, so you won’t need to jump between different platforms during keyword research.
Keywords Everywhere key features
The extension displays search volume, CPC, and competition metrics on more than 20 platforms including Google, YouTube, Amazon, and eBay. Users can access multiple widgets that show related keywords, “People Also Search For” suggestions, and long-tail variations. The tool lets you analyze your competitors’ pages and extract their keyword densities.
Keywords Everywhere pros and cons
Pros:
Budget-friendly plans start at USD 7.00 per month
Accessible interface with clear data visualization
Works on more than 16 websites beyond Google
Has social media metrics for X, Instagram, and Pinterest
Cons:
Credits expire after one year
Free plan has limited keyword data
ChatGPT templates lack full customization options
Keywords Everywhere pricing
The tool’s credit system equates 1 credit to 1 keyword. A Bronze plan costs USD 84.00 yearly and gives you 100,000 credits. The Silver plan provides 400,000 credits at USD 168.00 per year. Gold and Platinum tiers offer 2 million and 8 million credits respectively.
Keywords Everywhere best use case
Bloggers and content creators will find this tool valuable for quick keyword insights without switching apps. The tool proves especially useful for eCommerce businesses that need keyword research on Amazon, eBay, and Etsy.
LowFruits is a focused keyword research tool that helps find easy-to-rank opportunities other larger tools miss. The tool specializes in identifying low-hanging fruit in the SEO world.
LowFruits key features
The platform’s flagship Weak Spots analysis identifies SERPs where low-authority websites rank well. LowFruits’ Keyword Finder uses Google Autosuggest to find long-tail keywords that match user searches. The tool includes Domain Explorer to spot weak competitors, Extract functionality to pull keywords from existing websites, and a Rank Tracker to monitor performance.
LowFruits pros and cons
Pros:
Simple, accessible interface with minimal learning curve
Practical focus on keywords where small websites can actually compete
Affordable credit-based system ideal for occasional research
Smart use of Domain Authority to show realistic ranking opportunities
Cons:
Limited to keyword research without backlink analysis or site audits
Credit-based system might not suit those doing daily research
Data occasionally lags behind enterprise-level competitors
LowFruits pricing
The platform offers pay-as-you-go credits and subscription plans. Credits cost from USD 25.00 for 2,000 to USD 250.00 for 50,000. Standard plan subscriptions begin at USD 21.00/month (billed annually) with 3,000 monthly credits. Premium plans provide 10,000 credits at USD 62.00/month.
LowFruits best use case
LowFruits works best for new websites with low domain authority that need realistic ranking opportunities. Small business owners targeting local keywords, bloggers building niche sites, and content creators following a topical authority strategy will find this tool particularly useful.
Bing Webmaster Tools is a free platform that helps you monitor how your site performs in Bing’s search results. Many SEO professionals overlook this keyword research tool despite its useful capabilities that work well with other SEO platforms.
Bing Webmaster Tools key features
The platform comes with unique features that include Site Explorer to analyze website structure, IndexNow for instant content indexing, and a resilient Keyword Research tool that shows Bing-specific search volumes. Users get detailed SEO Reports with useful recommendations and Backlinks analysis to help you scrutinize competitors’ link profiles.
Bing Webmaster Tools pros and cons
Pros:
No cost to use without premium tiers
Specific fix suggestions in detailed SEO error reports
Knowing how to view competitor sites’ backlinks
Microsoft Clarity integration shows heatmaps and user behavior analysis
Cons:
Shows only Bing search data
Nowhere near as detailed as Google-focused alternatives
Cluttered interface at times
Data updates slower than premium tools
Bing Webmaster Tools pricing
Users can access all features free of charge without paid tiers or subscriptions.
Bing Webmaster Tools best use case
The platform works best as a complementary SEO solution, especially when you have businesses in the Microsoft ecosystem where Bing captures much user traffic. It helps you find keywords that show different search patterns across engines.
ChatGPT, built on GPT-4o, adds AI capabilities to keyword research that complement traditional SEO tools. Content creators will find it works differently from evidence-based platforms but provides valuable insights.
ChatGPT key features
SEO professionals can use ChatGPT to generate keyword suggestions based on topics and organize them into semantic clusters. The tool analyzes search intent and creates content outlines. Users can also create schema markup and receive optimization strategy suggestions.
ChatGPT pros and cons
Pros:
Quick and efficient processing of large data sets
Language capabilities that help target global audiences
Strong support for keyword ideation and content structure
Useful templates for link building outreach
Cons:
No immediate search volume data or competition metrics
Potential for inaccurate or “hallucinated” information
Fewer technical SEO features than specialized tools
Content might be too generic without proper direction
ChatGPT pricing
The platform’s pricing structure includes a Free plan with basic access. Users can upgrade to Plus for $20/month with better features, or Pro at $200/month for advanced capabilities. Business plans cost $25-30 per user monthly.
ChatGPT best use case
The tool works best with specialized SEO platforms. ChatGPT shows particular strength in initial keyword brainstorming, content enhancement, and task automation.
Comparison Table
Tool Name
Key Features
Starting Price
Best Use Case
Notable Pros
Notable Cons
Google Keyword Planner
– Keyword finder – Search volume data – Location targeting – Historical data
Free
Early-stage keyword brainstorming & local business research
– Detailed local search data – Direct Google data access
The right keyword research tools can make or break your SEO strategy. My experience in this field shows how proper keyword research contributes to that significant 20% of work that drives 80% of website results. Each tool brings specific strengths that match different scenarios and budgets.
Businesses with limited resources can start with free options like Google Keyword Planner, Google Autocomplete, and Google Trends. Platforms such as Ahrefs and Semrush provide informed analysis when your business is ready to invest more in SEO.
Specialized tools excel in their particular areas. Clearscope and Surfer focus on content optimization, while AlsoAsked and Answer Socrates find question-based opportunities others miss. LowFruits helps new websites discover easily winnable keywords they need.
The best results come from combining complementary tools. You could pair Google Keyword Planner’s volume data with Answer Socrates’ question research and optimize your content using Surfer or Clearscope.
Your specific needs should guide your selection. Small businesses or bloggers might start with Ubersuggest or Keywords Everywhere because they’re affordable and simple to use. Content marketers who focus on topical authority benefit from Surfer’s complete approach. Enterprise teams managing multiple projects will find Semrush or Ahrefs worth the investment.
Keyword research forms the foundation of successful SEO campaigns. The tools you pick today will shape your content strategy, rankings, and traffic over the next several years. Take time to review which combination works best for your goals, budget, and technical capabilities. The right tools in your SEO arsenal will help change your online presence and drive meaningful business results.
FAQs
Q1. What is the best free keyword research tool for beginners? Google Keyword Planner is an excellent free option for beginners. It provides keyword ideas, search volume data, and competition metrics directly from Google, making it ideal for initial keyword research and brainstorming.
Q2. Which tool is most effective for finding low-competition keywords? LowFruits is specifically designed to uncover easy-to-rank keyword opportunities. It focuses on identifying SERPs where low-authority websites are currently ranking, making it ideal for new websites or those targeting niche markets.
Q3. How do Ahrefs and Semrush compare for comprehensive SEO research? Both Ahrefs and Semrush are powerful, comprehensive SEO platforms. Ahrefs is known for its extensive backlink database and user-friendly interface, while Semrush offers a larger keyword database and broader digital marketing features. The choice often depends on specific needs and budget.
Q4. Can AI tools like ChatGPT replace traditional keyword research methods? While AI tools like ChatGPT can be valuable for generating keyword ideas and content outlines, they currently lack real-time search volume data and competition metrics. They work best as a complement to traditional keyword research tools rather than a replacement.
Q5. What’s the most cost-effective way to conduct professional-level keyword research? A combination of free tools like Google Keyword Planner and Google Trends, along with a more affordable paid option like Ubersuggest or Keywords Everywhere, can provide a solid foundation for professional-level keyword research without breaking the bank.
Meta’s ad platform in 2026 is a different machine than it was even two years ago. Advantage+ campaigns have replaced much of the manual structure advertisers relied on. Meta Lattice — the consolidated AI model across Facebook, Instagram, and other surfaces — drove a 12% increase in ad quality in Q4 2025. Over 4 million advertisers now use Meta’s generative AI tools. The platform’s algorithm is dramatically more capable than before, but that capability only helps if you stop feeding it the wrong inputs.
The mistakes in this guide aren’t theoretical. They’re the specific errors that show up across hundreds of audited accounts — the ones that quietly waste 30-50% of budget without ever looking like a failure in the dashboard. A typical ecommerce brand spending $10,000/month can lose $3,000-$4,000 to these issues.
Each mistake below includes what the error looks like, why it damages performance, and the specific fix.
1. Fragmenting Your Budget Across Too Many Campaigns and Ad Sets
This is the single most common structural mistake in 2026 accounts, and it usually comes from advertisers who built their approach on 2020-2022 best practices.
What it looks like: 8-15 ad sets, each targeting a slightly different interest group, each with $20-50/day in budget. None generating enough conversions to exit the learning phase.
Why it kills performance: Meta’s algorithm needs approximately 50 optimization events per week per ad set to exit the learning phase and optimize effectively. If your target CPA is $30, that means each ad set needs at least $1,500/week ($214/day) to hit that threshold. Splitting $1,000/month across five ad sets gives each one $6.67/day — far below what the algorithm needs to learn anything.
One consolidated campaign at $500/day outperforms five campaigns at $100/day each, because more data per campaign means better learning, which means more efficient optimization.
How to fix it: Calculate your minimum daily budget per ad set: (Target CPA x 50) / 7. If that number is higher than what you’re spending per ad set, consolidate. For most accounts, 1-2 campaigns with 2-3 ad sets each is the right structure. Use Advantage+ Campaign Budget to let Meta dynamically allocate spend across ad sets rather than fixing budgets manually. If your total monthly budget is $5,000, run two to three ad sets maximum.
2. Choosing the Wrong Campaign Objective
Meta’s algorithm follows instructions literally. Tell it to optimize for clicks, and it will find people who click — not people who buy.
What it looks like: A “Traffic” objective on a campaign designed to generate sales. Or a “Reach” objective for lead generation. The dashboard shows healthy CTR, but actual conversions are minimal.
Why it kills performance: The algorithm optimizes exactly for what you ask. Selecting “Traffic” tells Meta to find click-happy browsers. These users look great in click metrics but rarely convert. One Linear Design client cut their cost-per-acquisition by 40% in a single week by switching from Traffic to the correct Sales objective — same budget, same creative, different algorithmic instruction.
How to fix it: Match objectives to actual business goals. Use the Sales objective for purchases, Leads for lead generation, Traffic only when you genuinely need page visits (brand awareness, blog readership). For ecommerce, Advantage+ Sales Campaigns should be your default structure — they consolidate targeting, placement, and creative optimization into a single AI-optimized campaign type. Meta reports ASC delivers 17% lower cost per purchase than manual campaigns.
3. Fighting the Learning Phase Instead of Protecting It
Every significant change to an ad set — new creative, budget adjustment over 20%, paused ads, audience changes — resets the learning phase. The algorithm must re-accumulate 50 conversions from scratch.
What it looks like: An advertiser launches a campaign, sees higher-than-expected CPAs in the first 3-4 days, panics, and starts making changes. They swap creative, adjust the budget, narrow the audience. Each edit resets learning. The campaign never exits the learning phase, and cost per result stays permanently elevated. Meta flags this as “Learning Limited.”
Why it kills performance: During the learning phase, performance is inherently unstable. CPAs can be 2-3x your eventual stable cost. That instability is the algorithm exploring — testing different users, placements, and times to find what converts. If you interrupt that exploration, you pay the exploration cost (high CPAs) without ever getting the benefit (optimized delivery).
How to fix it: Establish a strict “no-touch window” of at least 7 days after launching or making any significant change. Scale budget in increments of no more than 20% every 3-5 days. Don’t pause or edit individual ads during the learning phase. If you must test new creative, add it to the ad set rather than replacing existing ads. Monitor, but don’t intervene, until you have statistically meaningful data.
4. Targeting the Wrong Audience
Strong creative shown to the wrong people performs worse than mediocre creative shown to the right people. Audience targeting errors are silent — campaigns look “okay” while underperforming by 30-50%.
What it looks like: Either too broad (targeting everyone in a country with no filtering) or too narrow (hyper-specific interest stacks that limit the audience to 50,000 people). Both fail, but for different reasons. Broad targeting wastes impressions on uninterested users. Narrow targeting starves the algorithm of data and drives up costs.
Why it kills performance: iOS privacy changes have reduced Meta’s ability to track cross-platform behavior, leading to an estimated $10 billion revenue impact. Many detailed targeting options have been removed from Ads Manager. The algorithm in 2026 is better at finding buyers in broader audiences than most advertisers expect — but it still needs guardrails.
How to fix it: For prospecting, target audiences between 1-10 million users (for most markets). Use 1-2 well-chosen targeting criteria rather than 5-6 stacked filters. For Advantage+ campaigns, use broad targeting and let the algorithm do the exploration — guide it through creative signals rather than audience constraints. Use Lookalike Audiences seeded from your highest-value customer segments (purchasers, high-LTV customers) rather than low-quality seeds like page followers.
5. Audience Overlap: Bidding Against Yourself
When multiple ad sets target audiences that substantially overlap, you’re competing against yourself in Meta’s auction. You pay more for the same impressions.
What it looks like: Three ad sets — one targeting “fitness enthusiasts,” one targeting “gym-goers,” and one targeting “health and wellness” — all in the same campaign. The overlap can be 40-60% across these audiences. Meta charges you twice to reach the same people.
Why it kills performance: Beyond the direct cost inflation, audience overlap confuses Meta’s delivery optimization. The algorithm can’t clearly differentiate which ad set is performing best when they’re all reaching the same users.
How to fix it: Use Meta’s Audience Overlap tool (in Audiences > select multiple audiences > Actions > Show Audience Overlap). If overlap exceeds 30-40%, merge the audiences or exclude one from the other. Keep one audience per intent stage and differentiate clearly. For most accounts, consolidating from 8-10 overlapping ad sets into 3-4 distinct ones immediately reduces wasted spend.
6. Ignoring Custom Audiences
Cold prospecting to unknown audiences is the most expensive way to acquire customers. Custom audiences — built from people who’ve already interacted with your brand — convert at dramatically higher rates.
What it looks like: Every campaign targets interest-based cold audiences. No retargeting of website visitors, email subscribers, video viewers, or past purchasers. The most valuable targeting data the business owns goes unused.
Why it kills performance: Custom audiences target people who already know your brand. They convert at 3-8x the rate of cold traffic because they’ve already expressed interest. One documented case study showed a 492% increase in conversions after implementing custom audiences.
How to fix it: Build custom audiences from every data source available: website visitors (segmented by pages visited, time on site, and recency), customer email lists, app activity, video viewers (25%/50%/75%/95% completion), and engagement audiences (people who interacted with your Facebook/Instagram content). Sync CRM data with Meta automatically — tools exist that push updates every 6 hours. Create segments: website visitors (7 days, 30 days, 90 days), past purchasers (30 days, 90 days, 180 days), email subscribers by engagement level.
7. Not Excluding Past Converters
Showing acquisition offers to people who already purchased is throwing money at users who don’t need convincing.
What it looks like: No exclusion audiences set up. Acquisition campaigns show ads to existing customers. ROAS looks decent on paper because existing customers convert easily — but no new customers are being acquired.
Why it kills performance: Each impression served to a past converter is a wasted impression that could have reached a new prospect. This also creates a poor user experience — no one wants to see ads for products they already bought, especially at lower prices. It damages brand perception and invites negative feedback.
For Advantage+ Sales campaigns specifically, this mistake is amplified. Without an existing customer budget cap, Meta’s algorithm defaults to the easiest conversions — retargeting existing buyers. Your ROAS report looks great, but you’re not growing.
How to fix it: In standard campaigns, add exclusion audiences for recent purchasers, active subscribers, and users who completed the target action. In Advantage+ Sales campaigns, set an existing customer budget cap between 20-30% to start. This forces the algorithm to allocate the majority of budget toward prospecting. Customer list match rates typically range from 20-70% — include multiple data points (email, phone, name) to improve matching accuracy.
8. No Funnel Structure: Running Conversion Ads to Cold Traffic
Asking a cold audience to purchase on their first exposure to your brand is like proposing on a first date. Some will say yes. Most won’t.
What it looks like: A single campaign optimized for purchases, targeting a cold interest-based audience, sending them directly to a product page. High CPAs, low conversion rates, and the conclusion that “Facebook ads don’t work.”
Why it kills performance: Cold traffic needs education and trust-building before a purchase decision. When you optimize for purchases against cold audiences with limited budget, the algorithm struggles to find enough converters to exit the learning phase. You end up stuck in “Learning Limited” permanently.
How to fix it: Build a three-stage funnel. Top: awareness campaigns (video views, reach) at low frequency (1.5 or under) to introduce your brand. Middle: retargeting campaigns targeting people who watched your videos or visited your site, with consideration-level content (testimonials, comparisons, how-it-works). Bottom: conversion campaigns targeting warm audiences (website visitors, video completions, email subscribers) with direct offers. Follow an 80/20 budget rule — 80% on prospecting/cold awareness, 20% on retargeting/warm conversion.
9. Broken or Incomplete Conversion Tracking
If you can’t measure what happens after someone clicks your ad, optimization becomes an expensive guessing game.
What it looks like: Pixel installed only on the homepage. No server-side tracking. No Conversions API. Events not firing on key conversion pages. Or worse — duplicate pixel installations causing double-counted conversions. The advertiser sees zero purchases in Ads Manager despite actual orders coming through the payment processor.
Why it kills performance: Ad blockers and iOS privacy restrictions leave 20-30% of purchase events untracked when relying on browser-side Pixel alone. A Stape case study found that implementing server-side tracking restored 46% of previously blocked traffic and increased attributed Meta Ads conversions by 93%. Without accurate data, Meta’s algorithm can’t optimize — it doesn’t know who converted, so it can’t find more people like them.
How to fix it: Implement both Meta Pixel and Conversions API (CAPI) with proper deduplication. CAPI sends conversion data directly from your server to Meta, bypassing browser-side limitations. Use unique event IDs that match across both Pixel and CAPI to prevent double-counting. Verify your domain in Business Manager. Use the Meta Pixel Helper Chrome extension to check that events fire correctly on every step of your conversion funnel (PageView on all pages, ViewContent on product pages, AddToCart, InitiateCheckout, Purchase on confirmation page). Monitor your Event Match Quality score in Events Manager — aim for 6.0 or above (above 7.0 is excellent). Higher scores mean better attribution, improved audience building, and more efficient algorithm optimization.
10. Poor Ad Creative
Users spend an average of 1.7 seconds on mobile content. Your creative has that long to stop the scroll, communicate value, and motivate action.
What it looks like: Low-resolution images, cluttered layouts, designs that scream “advertisement” in a feed of organic content. Or the opposite extreme — overproduced studio shots that feel sterile and inauthentic. Text-heavy images that overwhelm. Creative that looks good on desktop but falls apart on the mobile screens where 81.8% of Facebook users actually browse.
Why it kills performance: Native-looking content consistently outperforms polished ad creative. Users scroll past anything that feels like an obvious advertisement. The disconnect between ad style and organic feed content destroys engagement before the message is even processed.
How to fix it: Design mobile-first. Use vertical or square aspect ratios (9:16 for Stories and Reels, 1:1 or 4:5 for feeds). Keep text minimal — Meta’s research confirms users prefer ads with less text. Show people using your product rather than isolated product shots. UGC-style creative (user-generated content or content that mimics it) consistently outperforms studio-produced assets. Minimum image resolution: 1080×1080 pixels. Test different creative styles with the same audience to find what works for your specific category.
11. Insufficient Creative Volume and Diversity
Meta’s algorithm in 2026 needs volume. Launching with 3-5 creative assets and expecting optimization is like giving the algorithm a sample size of one.
What it looks like: An Advantage+ Sales campaign with 3 image ads and nothing else. The algorithm picks a “winner” within 48 hours and serves that single ad for the rest of the campaign’s life. Performance starts strong, then rapidly declines as the audience fatigues.
Why it kills performance: Meta’s algorithm tests and personalizes creative in real time. More creative assets give it more combinations to test across different audiences, placements, and contexts. Motion’s 2026 study of over 550,000 ads found that only about 6% of ads drive the majority of spend. If you launch with 5 ads, the probability of including a winner in that set is low. Advantage+ campaigns perform best with 15-30 active creatives, refreshed with 3-5 new assets weekly.
How to fix it: Launch campaigns with at least 10-15 creative assets. Mix formats: static images, short videos (under 15 seconds for Reels), carousels, and UGC clips. Rotate new creative every 7-14 days. Use Meta’s AI creative tools for rapid variation — background generation, text overlay variations, aspect ratio adaptation — but always check that AI-generated assets match your brand guidelines, use correct aspect ratios for each placement, and maintain visual consistency.
12. AI-Generated Creative Without Brand Controls
As AI tools become the default for creative production, a new category of mistakes has emerged.
What it looks like: AI image generators producing assets at 1:1 that Meta crops for 9:16 Story placements, losing critical visual information. Brand colors drifting across assets. Font inconsistency. Tone shifts between ads in the same campaign. Over time, the ad account starts to look like it belongs to four different companies.
Why it kills performance: Brand inconsistency erodes recognition and trust. Incorrect aspect ratios mean key product information or CTA elements get cropped out in certain placements. The advertiser sees strong performance on Feed but poor performance on Stories/Reels — without realizing the creative is literally broken on those placements.
How to fix it: Feed AI tools explicit brand parameters before generating any creative. Set aspect ratio requirements per placement: Facebook Feed (1.91:1 or 1:1), Instagram Feed (1:1 or 4:5), Stories and Reels (9:16). Review every AI-generated asset on each intended placement before publishing. Maintain a brand style guide that AI tools reference for colors, fonts, photography style, and tone. Use Meta’s creative preview to check how ads render across all placements.
13. Weak Headlines and Missing Value Propositions
About 59% of people make their engagement decision without reading past the headline. A weak headline means losing the majority of potential viewers before they process your offer.
What it looks like: Generic headlines that could apply to any business (“Shop Now,” “Learn More,” “Don’t Miss Out”). Or no headline at all — marked “optional” during ad creation, so skipped. No clear articulation of why the user should care. Vague claims with no specificity.
Why it kills performance: Headlines are the bridge between initial visual attention and deeper engagement. Without a clear value proposition, the user has no reason to stop scrolling. Companies waste an estimated $37 billion annually on ads that fail to connect with audiences. Meta’s algorithm also factors in engagement quality — ads with weak headlines get lower relevance scores, which increases cost per impression.
How to fix it: Keep headlines under 40 characters — short headlines get 86% more engagement. Use numbers when possible (36% more clicks). Lead with the benefit, not the feature. “Save 3 hours/week on bookkeeping” beats “Accounting software for small business.” Make your value proposition answer one question: why should this specific person give you their time, attention, and money? Back claims with specifics — hard numbers, percentages, timeframes.
14. Guessing Instead of Testing (or Testing Everything at Once)
Both extremes waste money. Never testing means never improving. Testing too many variables simultaneously means never knowing what worked.
What it looks like: Either: (a) launching campaigns and letting them run indefinitely with no optimization, or (b) launching 10 variations changing audience, creative, copy, and placement all at once, then concluding that “the purple image with the long headline for women 35-44 works” when the data actually doesn’t support that granular a conclusion.
Why it kills performance: Without controlled testing, you can’t isolate cause and effect. A cosmetics ecommerce manager launched several campaigns with different images, videos, and budget tweaks simultaneously — some won, but she never knew what made them successful. She kept making educated guesses instead of building systematically on proven results. Meanwhile, one digital agency maintained a disappointing 20% ROAS for months because they followed rigid media plans instead of testing and adapting.
How to fix it: Test one variable at a time. Allocate 10-20% of total ad budget to testing. Run each test for at least 7 days to collect meaningful data. Use a clear hypothesis format: “Changing optimization from link clicks to landing page views will lower cost per result by 15%.” Use Meta’s built-in A/B testing tool rather than running informal side-by-side comparisons. For accounts spending under $50,000/month, limit active tests to 5-10 ads to preserve budget concentration.
15. Ignoring Ad Frequency Until Performance Collapses
By the time you notice performance declining from ad fatigue, you’ve already wasted budget showing the same ad to people who’ve tuned it out.
What it looks like:Frequency metrics above 2.5 for cold audiences or above 5 for warm audiences. Users seeing the same ad 10+ times. One client was spending $500/day on a retargeting campaign with 12.8 frequency — users were seeing their ads nearly 13 times each.
Why it kills performance: Meta’s algorithm starts charging more to show your ads once engagement drops from overexposure. Cost per result can double compared to earlier performance. Meta labels this “Creative Limited” when costs begin rising and “Creative Fatigue” when costs double. High frequency also triggers negative feedback — users report your ads as irrelevant, which damages delivery for future campaigns.
How to fix it: Set frequency caps using Meta’s frequency controls — 1-2 views per week per user typically achieves 80-95% of potential brand impact without fatigue. Monitor frequency daily on high-spend campaigns. Refresh creative proactively before frequency becomes a problem — don’t wait for the performance decline. When frequency climbs, expand the audience rather than increasing the budget on the same pool. After expanding the audience and refreshing creative, one Linear Design client saw their conversion rate double and CPA drop by 40%.
The Pattern Across All 15 Mistakes
Every mistake on this list shares one underlying cause: the advertiser is working against Meta’s algorithm instead of with it.
Meta’s delivery system in 2026 is built to optimize. Advantage+ consolidates decisions the algorithm can make better than humans (audience selection, placement allocation, budget distribution). But the algorithm needs the right inputs: correct objectives, sufficient budget concentration, clean tracking data, diverse creative, and enough time to learn.
When advertisers fragment budgets, interrupt learning phases, provide broken tracking data, or constrain audiences too tightly, they’re tying the algorithm’s hands and then blaming it for poor performance.
The fix for most accounts isn’t more complexity. It’s less. Fewer campaigns, more consolidated budgets, simpler audience structures, diverse creative fed consistently, accurate tracking, and the patience to let the algorithm do what it’s designed to do.
Tupa helps international e-commerce and B2B companies grow profitably through data-driven Google Ads and SEO – with the execution speed of a China-based team and the transparency you expect from a Western agency.
Tupa is a certified partner in Google Ads
Kiara Foster
Head of Content
Kiara
Edit this chat template from WP Admin > Templates > Floating Elements