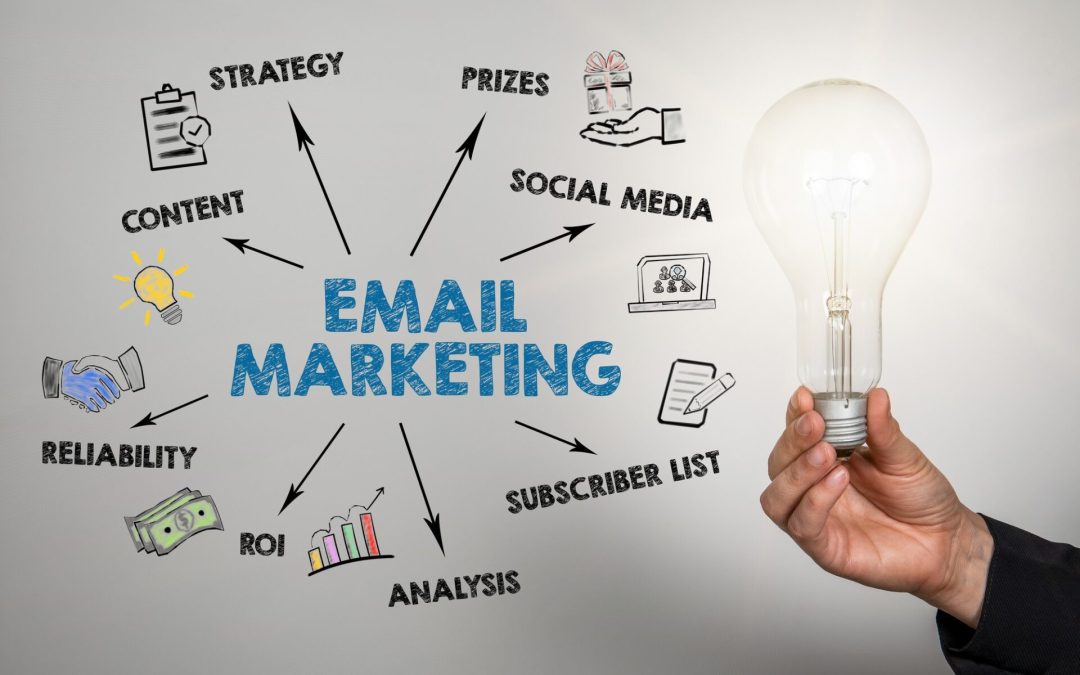
Email marketing generates roughly $36-$40 in revenue for every $1 spent — a return that no other digital marketing channel consistently matches. It reaches over 4.6 billion users globally, operates on infrastructure you own (your subscriber list isn’t subject to algorithm changes like social media reach), and gives you direct measurement of what drives opens, clicks, and purchases.
Those fundamentals haven’t changed. What has changed is the technical bar for getting into the inbox. Authentication protocols that were once optional are now required by Gmail and Yahoo for bulk senders. Apple’s Mail Privacy Protection has made open rates unreliable as a primary metric. AI-powered tools have made personalization and automation accessible at every budget level. And consumer expectations have shifted from tolerating batch-and-blast newsletters to expecting relevant, timely messages that reflect their actual behavior and interests.
This guide covers the complete email marketing strategy: deliverability infrastructure, list building, segmentation, lifecycle campaigns, content and design, automation, AI applications, measurement, and the ongoing optimization that turns email from a routine channel into your most predictable revenue driver.
Deliverability: The Foundation Everything Depends On
No email strategy matters if your messages land in spam folders. Deliverability — the percentage of emails that actually reach the inbox — is the technical foundation of email marketing. Before writing a single subject line, get this right.
Email Authentication (SPF, DKIM, DMARC, BIMI)
These four protocols tell inbox providers that your emails are genuinely coming from your domain, not from a spoofed source.
SPF (Sender Policy Framework) — a DNS record that specifies which mail servers are authorized to send email on behalf of your domain. Without it, inbox providers can’t verify that your email came from a legitimate source.
DKIM (DomainKeys Identified Mail) — adds a cryptographic signature to your emails that inbox providers can verify. It proves the message wasn’t altered in transit.
DMARC (Domain-based Message Authentication, Reporting, and Conformance) — tells inbox providers what to do when SPF or DKIM checks fail (quarantine the message, reject it, or do nothing). DMARC also sends reports back to you showing who’s sending email using your domain.
BIMI (Brand Indicators for Message Identification) — displays your brand’s logo next to your emails in supported inbox providers. Requires DMARC enforcement at quarantine or reject level. BIMI increases brand recognition in the inbox and can improve open rates.
Gmail and Yahoo now require SPF and DKIM authentication for bulk senders (more than 5,000 messages per day). DMARC is required at a minimum of p=none. Without these records properly configured, your emails will be rejected or sent to spam regardless of content quality.
Sender Reputation and IP Warming
Inbox providers assign reputation scores to your sending domain and IP address based on engagement patterns: bounce rates, spam complaints, unsubscribe rates, and recipient engagement. A new sending domain or IP has no reputation — and no reputation is treated almost as badly as a bad reputation.
If you’re launching email marketing on a new domain or switching email service providers, warm your IP gradually: start with your most engaged subscribers (people who opened or clicked recently), send small volumes (a few hundred per day), and increase volume by 20-30% daily as engagement metrics confirm inbox placement. Jumping from zero to 50,000 emails on day one triggers spam filters at every major provider.
Monitor your sender reputation through tools like Google Postmaster Tools (for Gmail delivery data), your ESP’s deliverability dashboard, and services like Sender Score or Microsoft SNDS.
List Hygiene
A clean list is a deliverable list. Remove hard bounces (invalid addresses) immediately — they damage your sender reputation with every send. Suppress addresses that haven’t engaged in 90-120 days and target them with a re-engagement campaign before removing them permanently.
Double opt-in (requiring new subscribers to confirm their email address via a confirmation link) reduces invalid addresses by up to 40% and produces subscribers with 25% higher engagement rates. The tradeoff is lower initial signup volume — but higher quality subscribers produce better results at every subsequent step.
Building and Growing Your List
Your email list is the asset. Social media followers belong to the platform. Search rankings depend on algorithm stability. Your email list belongs to you, and its quality determines the ceiling on everything else your email program can achieve.
Organic List Growth
Every signup should represent a person who genuinely wants to hear from you. Purchased lists violate anti-spam laws (CAN-SPAM, GDPR, CASL), damage your sender reputation, and produce near-zero conversion rates. Build organically through lead magnets (ebooks, templates, exclusive content, discount codes) placed on high-traffic pages, embedded signup forms on your website (header bar, footer, inline within blog content), exit-intent popups on commercial pages (use sparingly — aggressive popups hurt UX), gated content where the email exchange delivers genuine value, and cross-channel promotion (social media bios, YouTube descriptions, podcast show notes).
The lead magnet should solve a specific problem your target audience has. “Subscribe to our newsletter” converts poorly because it promises nothing concrete. “Get the 12-page pricing template we use for client proposals” converts well because it promises a specific, valuable deliverable.
Permission and Compliance
GDPR (EU), CAN-SPAM (US), CASL (Canada), and their regional equivalents all require explicit consent before sending marketing emails. Every email must include a visible unsubscribe link. Unsubscribe requests must be processed within 10 business days (CAN-SPAM) or immediately (best practice).
Beyond legal compliance, permission-based marketing produces better results. Subscribers who opted in voluntarily engage at higher rates, convert more frequently, and generate fewer spam complaints than subscribers who were added without clear consent.
Segmentation: The Revenue Multiplier
Segmented email campaigns generate 58% of all email revenue. Marketers who segment report 760% revenue increases compared to unsegmented sends. The data is unambiguous: sending the same message to your entire list underperforms dramatically compared to sending targeted messages to specific groups.
Segmentation Dimensions
Behavioral — based on what subscribers have done. Purchase history, browsing behavior, email engagement (openers vs non-openers), content downloads, cart abandonment. Behavioral segmentation produces the highest-performing campaigns because it reflects actual intent.
Demographic — age, location, gender, job title, company size. Useful for broad personalization but less predictive than behavioral data.
Lifecycle stage — where the subscriber is in their relationship with your brand. New subscriber, first-time buyer, repeat customer, lapsed customer. Each stage needs different messaging.
Engagement level — highly engaged (opened/clicked in the last 30 days), moderately engaged (30-90 days), disengaged (90+ days). Sending your best content to engaged subscribers and re-engagement campaigns to disengaged ones protects deliverability while maximizing performance.
Purchase value — segment by average order value or lifetime value. Your highest-value customers deserve different treatment (early access, exclusive offers, loyalty perks) than one-time buyers.
RFM Segmentation
RFM (Recency, Frequency, Monetary value) is one of the most effective segmentation frameworks for ecommerce email marketing. Score each subscriber on how recently they purchased, how frequently they purchase, and how much they spend. Group them into segments (Champions, Loyal Customers, At-Risk, Lost) and build campaigns tailored to each group.
Lifecycle Email Campaigns
Rather than thinking about email as a collection of disconnected campaign types, organize your email program around the customer lifecycle: acquisition, activation, retention, and reactivation. Each stage has specific campaign types that serve it.
Acquisition: Welcome Series
The welcome series is your highest-leverage automation. Welcome emails see an average 50%+ open rate — far above any other campaign type. Send the first email immediately after signup, then follow with 3-5 additional emails over the next 7-14 days.
The series should set expectations (what you’ll send, how often), deliver the promised lead magnet or offer, introduce your brand story and value proposition, highlight your best content or products, and include a clear first-purchase incentive. Most purchase decisions happen within 10 days of subscribing. Your welcome series is the window for converting new subscribers into first-time buyers.
Activation: Onboarding and First Purchase
For SaaS and subscription businesses, onboarding emails guide new users through product setup and key features. For ecommerce, activation emails help first-time buyers discover related products, understand shipping and returns, and feel confident in their purchase.
The goal is moving subscribers from passive list members to active, engaged customers. Track activation rate (percentage of subscribers who complete a key action within a defined timeframe) as a leading indicator of long-term value.
Retention: Newsletters, Education, and Loyalty
Retention emails keep engaged customers coming back. Regular newsletters (weekly or biweekly) share valuable content, product updates, and curated recommendations. Educational content positions your brand as a trusted resource. Loyalty campaigns reward repeat customers with exclusive offers, early access, and recognition.
The key to retention emails: every message should deliver genuine value, not just promote products. A balanced ratio of value-to-promotion (roughly 80% useful content, 20% promotional) keeps subscribers engaged without causing fatigue.
Reactivation: Win-Back Campaigns
Reactivation emails target subscribers who haven’t engaged in 60-120 days. They cost significantly less than acquiring new subscribers and can recover 5-15% of lapsed contacts.
Effective win-back sequences typically include a “we miss you” message acknowledging the gap, a reminder of benefits or recent improvements, a special incentive (discount, free shipping, exclusive content), and a final “should we remove you?” message that leverages loss aversion.
Subscribers who don’t respond to the full win-back sequence should be suppressed. Continuing to email unengaged contacts damages your sender reputation and reduces deliverability for your entire list.
Transactional Emails
Order confirmations, shipping notifications, password resets, and account alerts. These emails have the highest open rates of any email type (often 80%+) because recipients expect and need them. Despite being functional, they’re brand touchpoints — design them with the same care as marketing emails. Include product recommendations, cross-sell suggestions, or referral incentives where appropriate.
Content and Design
Subject Lines
Your subject line determines whether the email gets opened. Keep it under 50 characters (mobile truncation starts around 35-40 characters on most devices). Personalized subject lines (including the recipient’s name or a reference to their behavior) improve open rates measurably. Specific, benefit-oriented language (“Your order ships tomorrow” or “The template you requested”) outperforms vague or clever phrasing.
Avoid spam trigger words (“FREE!!!”, “Act now”, “Limited time”) and excessive punctuation. A/B test subject lines on every send — small improvements in open rate compound across your entire program.
Mobile-First Design
Over half of all emails are opened on mobile devices. Design for mobile first, then adapt for desktop — not the reverse.
Mobile-first principles: single-column layout (600px maximum width), minimum 14px body font size (16px is better), tap-friendly CTA buttons (minimum 44x44px), adequate spacing between clickable elements, and lightweight HTML that loads quickly on mobile connections. Pre-header text (the preview text visible in the inbox after the subject line) should reinforce the subject line’s value proposition, not repeat it or default to “View in browser.”
CTAs That Convert
Every email should have one primary call-to-action. Multiple competing CTAs create decision paralysis and reduce click-through rates. Button CTAs outperform text links by approximately 27%. Use specific, action-oriented copy — “Get the template” converts better than “Click here” or “Learn more.”
Place your primary CTA above the fold (visible without scrolling) and repeat it at the end of the email for longer messages.
Automation: Revenue That Runs Without You
Automated email sequences generate significantly more revenue per recipient than manual campaigns because they deliver the right message at the right moment based on subscriber behavior.
Essential Automations
Welcome series — triggers immediately after signup. Your most important automation.
Abandoned cart / abandoned browse — triggers when a subscriber adds items to cart (or views products) without purchasing. Cart abandonment emails recover 5-15% of abandoned revenue.
Post-purchase — triggers after a purchase. Thank the customer, provide order details, suggest related products, and ask for a review after delivery.
Re-engagement — triggers after a defined inactivity period. Attempt to win back lapsed subscribers before suppressing them.
Birthday / anniversary — triggers on personal milestones. Simple to set up, consistently high-performing.
Behavioral Triggers vs. Time-Based Drips
Time-based drips send emails on a fixed schedule (Day 1, Day 3, Day 7). Behavioral triggers send emails in response to specific actions (viewed a pricing page, downloaded a resource, abandoned a cart). Behavioral triggers consistently outperform time-based drips because they respond to demonstrated intent rather than arbitrary timing.
AI in Email Marketing
AI tools have made sophisticated email optimization accessible to teams of any size. The most impactful applications right now are AI-powered subject line generation and testing (tools suggest and score subject lines based on predicted performance), send-time optimization (AI determines the optimal send time for each individual subscriber based on their historical engagement patterns), predictive segmentation (AI identifies subscribers likely to purchase, churn, or upgrade based on behavioral patterns), and content generation assistance (AI drafts email copy, subject lines, and CTAs that humans refine with brand voice and strategic context).
AI doesn’t replace email strategy — it accelerates execution and optimization. The strategic decisions (who to target, what to say, what actions to drive) remain human. The tactical optimization (when to send, which subject line to use, which segment to prioritize) increasingly benefits from AI assistance.
Measurement: Metrics That Matter
Primary Metrics
Click-through rate (CTR) — the percentage of recipients who clicked a link. This is now a more reliable engagement metric than open rate because Apple’s Mail Privacy Protection inflates open rate data for Apple Mail users (approximately 50%+ of all email opens). Track CTR as your primary engagement indicator.
Conversion rate — the percentage of recipients who completed the desired action (purchase, signup, download). This connects email performance to business outcomes.
Revenue per email — total revenue attributed to an email divided by the number of emails sent. The most direct measure of email ROI.
List growth rate — net new subscribers minus unsubscribes and bounces. A healthy list grows consistently while maintaining engagement quality.
Secondary Metrics
Open rate — still useful for subject line comparison (A/B testing) but unreliable as an absolute engagement measure due to MPP. Compare open rates within your own campaigns rather than against industry benchmarks.
Bounce rate — keep below 2%. Hard bounces should trigger immediate suppression.
Unsubscribe rate — sustained rates above 0.5% per send signal content or frequency problems.
Spam complaint rate — keep below 0.1%. Rates above this threshold damage your sender reputation and can trigger inbox provider penalties. Gmail’s new requirement sets 0.3% as the maximum before enforcement actions.
Attribution
Connect email to revenue using UTM parameters on every link, your ESP’s built-in revenue attribution, and integration between your email platform and your ecommerce/CRM system. Track both direct attribution (someone clicked an email link and purchased in the same session) and assisted attribution (email was part of the conversion path but not the last touch).
Frequently Asked Questions
How often should I send marketing emails?
There’s no universal answer — it depends on your audience, your content, and your business model. Ecommerce brands often send 3-5 times per week during peak periods. B2B companies typically send 1-4 times per month. The test: are your engagement metrics (CTR, conversion rate) stable or improving? If unsubscribe rates spike or click rates decline with increased frequency, you’re sending too often. Start with once per week and adjust based on data.
What’s a good open rate for email marketing?
Open rate benchmarks vary by industry (15-30% is typical across industries), but open rate as a metric has become less reliable since Apple Mail Privacy Protection launched. MPP pre-loads tracking pixels for Apple Mail users, inflating open rates artificially. Use click-through rate as your primary engagement metric. If you need to benchmark opens, compare within your own historical data rather than against published benchmarks.
Should I use AI to write my marketing emails?
AI is excellent for generating first drafts, testing subject line variations, and suggesting content structures. But AI-generated email copy needs human editing for brand voice, factual accuracy, and strategic alignment. The most effective approach: use AI to accelerate production, then apply human expertise to ensure the final message reflects your brand’s personality and your audience’s specific needs.
What’s the best email marketing platform?
It depends on your business size, technical needs, and budget. For small businesses and startups: Mailchimp, ConvertKit, or MailerLite. For ecommerce: Klaviyo or Omnisend (deep ecommerce integration, strong automation). For B2B: HubSpot, ActiveCampaign, or Customer.io. For enterprise: Salesforce Marketing Cloud, Braze, or Iterable. Evaluate based on automation capabilities, segmentation depth, deliverability reputation, integration with your tech stack, and pricing that scales with your list size.
How do I reduce spam complaints?
Send only to people who opted in (never purchased lists). Set clear expectations during signup about what they’ll receive and how often. Include a visible, easy-to-find unsubscribe link in every email. Honor unsubscribe requests immediately. Segment by engagement and reduce frequency for less engaged subscribers. Authenticate your domain (SPF, DKIM, DMARC). Keep your spam complaint rate below 0.1% — Gmail enforces action at 0.3%.
Is email marketing still worth it compared to social media?
Email and social media serve different functions. Social media builds awareness and community. Email converts and retains. Email reaches subscribers directly without algorithmic filtering, produces significantly higher conversion rates than organic social, and generates measurably higher ROI. For most businesses, email is the higher-ROI channel for driving revenue from existing contacts, while social media is better for top-of-funnel discovery. Run both, but don’t treat them as interchangeable.
Creating display ads once meant designing about 20 different sizes to fit all possible ad spaces. Your design team had to custom tweak and resize each one manually.
The question of using responsive display ads has become much simpler to answer now. These dynamic ads leverage machine learning to fit your creative assets automatically into any ad space on the Google Display Network. Bloomberg Media saw remarkable results and reduced their cost-per-site-visit by 81% with responsive display ads. These adaptable formats generate more impressions than traditional ads because Google prefers them to fill inventory, and they deliver better click-through rates.
Responsive display ads do more than save design resources. They create optimized creatives dynamically based on available space and user context. Google’s algorithms work with up to 15 images and 5 logos that you can upload. The results speak for themselves – responsive display ads show a 59% increase in conversion after customers do related research.
Let’s explore how responsive display ads can fit into your marketing strategy. This guide will help you understand the basics to get started effectively.
What Are Responsive Display Ads?
Responsive display ads are Google’s flexible ad format that adjusts size, look, and format to fit spaces on the Google Display Network (GDN). Unlike traditional ads that need specific dimensions, these dynamic ads can appear naturally on millions of websites, apps, YouTube videos, and Gmail.
How they differ from static ads
Static display ads need advertisers to create specific-sized banners for each placement they target. These fixed-dimension creatives don’t adapt to different slots and look the same as their original design. Advertisers must create multiple versions of the same ad to show up properly on websites and devices of all sizes.
Responsive display ads take a different path:
They adjust to fit ad spaces using machine learning
They show up as banner ads, dynamic text ads, or other formats based on space
They need fewer resources but deliver better results
The biggest difference is in how you manage them. Static ads need separate creatives for each size and placement, which takes more time and resources. Responsive ads make this simple – you create one adaptable ad that works everywhere.
The performance numbers tell an interesting story. Google’s data shows responsive display ads get 10% more conversions at the same CPA compared to static campaigns. On top of that, Google’s internal standards show RDAs reach twice as many placements as static ads, and advertisers see 12% more conversions after switching to RDAs.
What’s provided by responsive display ads?
Responsive display ads work through asset combinations that Google’s AI arranges for each ad placement. You provide these elements when creating responsive display ads:
Visual elements:
Up to 15 marketing images
Up to 5 logos
Up to 5 videos
Text elements:
Up to 5 headlines
Up to 5 descriptions
Business name
Google’s machine learning tests these assets in different combinations to find what works best for your campaign goals. This removes the guesswork from ad creation as Google looks at performance data to optimize your ads.
Google might use asset enhancements, stock images, or AI-generated assets like backgrounds to boost ad performance. This creates endless creative combinations to make your campaign more effective.
Why Google made them the default
Google chose responsive display ads as the new default ad type for the Display Network because they adapt better and perform well. Several reasons backed this decision:
RDAs fix a basic problem in display advertising – creating multiple ad sizes for different placements. The GDN has more than 3 million inventory partners, making it impractical to create traditional ads for every placement.
Machine learning helps optimize ads continuously. The system tests combinations of headlines, images, and descriptions, then displays the versions that work best. Your click-through rates and conversions improve without manual work.
These ads reach more people. They can join more auctions and match more queries, which means more impressions and clicks. Google’s data reveals advertisers get 10% more conversions after switching to responsive display ads.
RDAs match today’s user habits. People view content on many devices with different screen sizes, and responsive ads look good whether someone sees them on a desktop, tablet, or phone.
Google simplified display advertising by making responsive display ads the default while helping advertisers get better results.
When Should You Use Responsive Display Ads?
The right timing for using responsive display ads can greatly affect your marketing success. These versatile ad formats work better than traditional static ads in several situations. Let’s look at the best times to use responsive display ads in your campaigns.
Limited design resources or time
Responsive display ads are perfect if you don’t have advanced design skills or enough time to create multiple ad versions. You don’t need special design expertise to create effective display ads. Google handles most of the work after you provide the simple creative assets—images, headlines, and descriptions.
This simple approach works best for:
Small businesses without dedicated design teams
Marketing departments facing tight deadlines
Campaigns requiring quick deployment
The automation behind responsive display ads saves a lot of time because you won’t need constant manual adjustments. Bloomberg Media’s experience shows this efficiency works well—they cut their cost-per-site-visit by 81% after switching to responsive display ads.
Need for broad reach across devices
Responsive display ads should be your first choice when you want to maximize audience reach. These ads naturally adjust to fit any ad space, making them perfect for campaigns targeting users on different devices and platforms.
Traditional display ads need separate versions for each format, but responsive ads naturally adapt to:
Desktop monitors of varying sizes
Tablet displays
Mobile phone screens
Different ad placement dimensions
This flexibility gives you access to many ad placements throughout the Google Display Network, helping you reach more people on desktop and mobile platforms. More audience access means better brand awareness and more potential conversions.
Running remarketing or dynamic campaigns
Responsive display ads work really well for retargeting. They help you reconnect with users who have already visited your website or app.
Online stores can use responsive display ads for dynamic remarketing—showing visitors products they’ve already looked at. This personal touch makes them great for:
Encouraging abandoned cart completion
Promoting related products
Reminding prospects about items they browsed
The numbers back this up—98% of website visitors aren’t ready to buy on their first visit, which makes remarketing through responsive display ads a smart choice.
Testing multiple creatives quickly
Responsive display ads give you a perfect testing ground if you want to try different ad elements without doing lots of manual work. Machine learning tests combinations of headlines, images, and descriptions automatically, then shows the versions that work best.
This built-in optimization:
Takes the guesswork out of creative testing
Finds winning combinations faster than manual A/B testing
Makes improvements based on real-time data
Many advertisers find that responsive display ads perform better than traditional display ads. The system tracks important metrics like impressions, clicks, and conversions, and uses this information to improve your ads automatically.
Responsive display ads work best when you need flexibility, wider reach, efficient resource use, or ongoing optimization without manual work. But traditional static ads might still be better if your campaign needs very specific layouts or carefully controlled messaging.
How to Set Up a Responsive Display Ad
Setting up responsive display ads becomes quite simple once you know what you’re doing. This section will show you exactly how to create these versatile ad formats in your Google Ads account.
Accessing your Google Ads account
Your first step to create responsive display ads starts with accessing the right section of your Google Ads account:
After logging in, click on the Campaigns icon in the navigation menu
Select Ads and Assets from the page menu
Click the blue “+” button
Choose “Responsive display ad” from the dropdown menu
Select the appropriate campaign and ad group where you want your ad to appear
Your responsive display ad needs to be part of a display campaign. You’ll need to set up a display campaign first if you haven’t already. Just click the blue plus button on your overview page and select “Display” as your campaign type.
Uploading images, logos, and videos
Visual assets are the foundations of your responsive display ad’s appeal. Here’s what you need to add:
Images Requirements:
At least one square (1:1) and one landscape (1.91:1) image must be included
You can upload up to 15 images for best results
The recommended dimensions are 1200×628 pixels for landscape and 1200×1200 pixels for square images
Each image should be under 5MB
You can use JPG, PNG, or non-animated GIF formats
Text should take up less than 20% of your image space
Logo Requirements:
Logos boost brand recognition though they’re optional
Square logos work best at 1200×1200 pixels while landscape logos should be 1200×300 pixels
Your logos will look best with transparent backgrounds
Adding Videos (Optional):
The “+” button below the Logos section lets you add YouTube videos
You can include up to five YouTube videos to boost engagement
Videos must be on YouTube since direct video uploads aren’t possible
Google makes finding images easy. You can scan your website for suitable images, pick from free stock image libraries, or upload your own creative work.
Adding headlines, descriptions, and final URL
The text elements of your ad need careful attention:
Headlines and Descriptions:
Write up to 5 short headlines (30 characters max each)
Create 1 long headline (90 characters max)
Add up to 5 descriptions (90 characters max each)
Your business name should be within 25 characters
Effective Text Practices:
Put key information first since headlines might show without descriptions
Make sure headlines and descriptions work well together
Your long headline should have a clear call-to-action
Use different messages across text fields
Final URL Setup:
Add the landing page URL for your ad clicks
Your landing page content should match your ad message
You can add tracking parameters through “Advanced URL options”
“More options” lets you pick call-to-action text and language
The ad strength indicator helps you measure your progress. A “Good” or “Excellent” rating comes from providing multiple assets in each category.
Previewing ad combinations
Before you finish your responsive display ad, use Google’s preview tools effectively:
The preview panel on the right shows how different combinations look
Check both mobile and desktop views for consistent quality
Look at different ad formats (banner, dynamic text, etc.)
Make sure images stay clear and messages remain readable at all sizes
Your call-to-action should stand out in every variation
Your responsive display ads can appear in thousands of different layouts across the Google Display Network. Click “Save” once you’re happy with the previews.
This structured approach helps create effective responsive display ads. The system tests different asset combinations to find what works best for your campaign goals.
Best Practices for Visual Assets
Your responsive display ads need strong visual elements to succeed. The way you format and present your images will affect how well your ads connect with potential customers. Without doubt, you’ll get better results when you know how to use these visual best practices.
Use both square and landscape images
The right mix of image formats helps create effective responsive display ads. Google needs at least two images – one landscape and one square. You’ll get the best results with these vital formats:
Landscape images: 1200 x 628 pixels recommended (minimum 600 x 314) with 1.91:1 aspect ratio
Square images: 1200 x 1200 pixels recommended (minimum 300 x 300) with 1:1 aspect ratio
While two images meet the minimum requirement, using 5-10 images for each aspect ratio works better. This gives Google’s algorithms more options to test and optimize your ads. You can add up to 15 marketing images, which helps the system find winning combinations.
Discovery campaigns work better with vertical (portrait) images too. These should have a 4:5 ratio with recommended dimensions of 960 x 1200 pixels (minimum 480 x 600).
Optimize logos for different formats
Your brand needs to stand out in all ad placements. This means you need properly formatted logo versions:
Square logos: 1200 x 1200 pixels recommended (minimum 128 x 128) with 1:1 ratio
Landscape logos: 1200 x 300 pixels recommended (minimum 512 x 128) with 4:1 ratio
Logos aren’t required, but they make your ads look much better. Google will use a basic icon like a globe or your brand’s first letter if you don’t add custom logos.
Here’s what makes logos work better:
Use transparent backgrounds when possible
Center your logo to avoid cropping issues
Keep the design simple and skip small text
Leave 1/16th padding around the logo
Avoid cluttered or unclear visuals
Simple, focused images work better than busy ones. Your product or service should be the star of each image. Note that blank space should not take up more than 80% of the visual.
Stay away from these common issues:
Collages or composite images
Digital composite backgrounds, including all-white backgrounds
Images with borders, skewed angles, or too much filtering
Overlaid logos or graphics on images
Text overlays (should not cover more than 20% of the image)
Your images will show up in different sizes, so keeping them simple helps them look good even when scaled down. Cleaner visuals perform better across all placements.
Use high-resolution images only
High-quality images are the life-blood of effective responsive display ads. Poor quality or unprofessional images will reduce your overall results.
Don’t use images that are:
Blurry or out of focus
Washed out or hard to see
Color-inverted
Upside-down or visually skewed
Over-filtered
Your images must meet these technical specs: JPG, PNG, or non-animated GIF formats with a maximum file size of 5MB per image. Quality visuals help users understand your business, products, and brand better – key factors in how well your ads perform.
These visual asset best practices will help your responsive display ads perform better and keep your brand consistent across the Google Display Network.
Writing Effective Headlines and Descriptions
Your responsive display ad’s performance depends on compelling text. The limited character space means each word must work hard to persuade your audience to take action.
Front-load key information
Your most important messages belong at the start of headlines and descriptions. This approach will give a better chance for core messages to reach viewers even if text gets cut off in smaller spaces. Headlines need to work on their own since they sometimes appear without descriptions. Google’s system might show only headlines when space is tight, which makes front-loaded content a vital part of your strategy.
Avoid repeating the same message
Google never shows multiple headlines together, so you can create variations without worrying about repetition. Each headline-description combination needs to make sense because Google mixes these elements to find the best pairings. Your descriptions should build on your headlines instead of saying the same thing again. This helps you make the most of your character limits and creates a complete message.
Include a clear call to action
Strong calls-to-action boost engagement by a lot. Action-oriented or value-focused CTAs encourage more clicks. The best results come from putting your CTA in your long headline (90 characters). This ensures users get your main message even if they only see a headline with an image. “Watch now” works well for video promotions, or you could try specific prompts like “Shop our sale today”.
Use all available text fields
The best performance comes from using all available text options:
Short headlines: Up to 5 (30 characters each)
Long headline: 1 (90 characters)
Descriptions: Up to 5 (90 characters each)
Business name: 25 characters maximum
Multiple variations let Google’s algorithm test different combinations to find what works best with different audiences. Your responsive ads tend to perform better when you provide more text options while maintaining quality standards. Note that descriptions always show up with headlines but never alone, so you can create them to complement each other.
Optimizing and Measuring Performance
Your responsive display ads need continuous optimization to maximize their performance. Regular management and measurement of your ads will give a better outcome from your display campaigns.
Use asset performance ratings
Google provides valuable feedback on each asset’s effectiveness once your responsive display ads have run for a while. These asset performance ratings group your headlines, descriptions, images, and logos into categories like “Best,” “Good,” or “Low”.
You can review these ratings by clicking “view asset details” to get a performance overview. Google doesn’t reveal the exact criteria behind these ratings, but they are a great way to get guidance on which elements appeal to your audience.
Replace low-performing creatives
You should refresh underperforming assets regularly. Replace items marked “Low” with new variations. It also makes sense to pause assets that get zero impressions after several weeks because they might not match the queries that trigger your ads.
Google suggests reviewing assets only after you have enough data. You need sufficient impressions to review click rates and enough clicks to assess conversion rates.
Make use of ad strength score
Ad Strength measures your ad assets’ relevance, quality, and diversity with ratings from “Poor” to “Excellent”. Your responsive ads can get 12% more conversions by improving Ad Strength from poor to excellent.
Weekly checks of Ad Strength will help optimize performance. You can follow Google’s specific suggestions to improve your score by adding more asset variety and text diversification.
Track conversions and engagement
The metrics that matter most depend on your business goals. Impressions show how often your assets appear, while conversions reveal actual business effects.
Looking beyond clicks helps paint a complete picture. You should think about including engaged-view conversions (EVCs) and view-through conversions (VTCs) in your performance analysis. These conversion types show when users see but don’t click your ad and later complete a conversion.
The most successful advertisers dedicate about an hour each week to analyze their ad performance. This consistent attention to detail helps your responsive display ads improve steadily.
Conclusion
Responsive display ads have reshaped the scene of digital advertising in the Google Display Network. These dynamic ads save time and resources and can deliver better results than static formats. They automatically adjust to different placements, so your message reaches audiences on any device or platform.
This piece shows you the best times to use responsive display ads – especially when you have limited design resources. They work great for broad reach, remarketing campaigns, and creative testing. The setup is simple: just upload quality visual assets and write compelling text. Google’s machine learning will optimize combinations to maximize performance.
Note that following best practices will give a soaring win. You should provide square and landscape images, use clean visuals, and write multiple headlines that put important information first. Check asset performance ratings often and replace underperforming creatives to improve results.
The numbers tell the story – responsive display ads deliver higher conversions at lower costs than traditional formats. Bloomberg Media’s cost-per-site-visit dropped by 81% after switching to responsive display ads. You haven’t tried this versatile ad format yet? Now is your chance to create responsive display ads and boost your digital advertising effectiveness.
Are you trying to figure out what makes a good CTR for Google Ads? You’re not alone. Recent data shows that a good click-through rate for Google Ads usually falls between 7% and 9%, though these numbers vary by industry. Most advertisers don’t reach these targets, and the average click-through rate for search ads sits at 6.42% in any discipline.
Click-through rates change a lot based on campaign types. Search ads get between 4-6% CTR, while display ads see much lower rates at about 0.57%. This happens because search users actively look for solutions, but display ads pop up during regular browsing. Ad position plays a big role too – top-ranked ads can reach CTRs of 7.11%, while ads in position nine only get about 0.55%.
This piece will show you industry-specific measures to review your performance. You’ll find what drives click-through rates and learn eight proven ways to boost your Google Ads CTR. You’ll also see how CTR connects with other key metrics like CPC and Quality Score that help you get better ROI from your ad spend.
What is Google Ads CTR and why it matters
Click-through rate is central to measuring Google Ads performance. You need to understand what this metric means and why it matters before you can determine what makes a good CTR for your campaigns.
Definition of click-through rate (CTR)
Click-through rate (CTR) shows how many people click your ad after seeing it on Google. This metric tells you how well your advertisement captures user interest and gets people to take action. Your ad appears when someone searches for terms related to your business, and CTR reveals how appealing that ad was to your target audience.
CTR tells you the number of people who found your ad relevant enough to click compared to everyone who saw it. Unlike complex metrics, CTR quickly shows how well your ad strikes a chord with viewers right away.
Google defines CTR as “a ratio showing how often people who see your ad or free product listing end up clicking it”. This simple metric reveals your ad’s appeal and relevance to people searching.
How CTR is calculated in Google Ads
The CTR formula is straightforward:
CTR = (Number of Clicks ÷ Number of Impressions) × 100
This calculation gives you a percentage that’s easy to understand. Let’s say your ad gets 100 clicks after 10,000 views – that’s a 1% CTR. If you get 500 clicks from 10,000 impressions, your CTR is 5%.
The Google Ads platform does these calculations for all your campaigns, ad groups, keywords, and individual ads. Knowing how the formula works helps you make sense of the numbers and improve your advertising strategy.
Why CTR is a key performance metric
CTR plays a vital role in the Google Ads ecosystem for several reasons.
Your Quality Score depends heavily on CTR—it makes up about 60% of the score that Google uses to rank ads [16, 17]. This affects both where your ad appears and how much you pay per click.
A high CTR means your message matches what users want. People who find your ads helpful click through to your website, which boosts your chances of converting them. Research shows that if you double your CTR, you might increase conversions by about 50%.
Better CTRs can improve your ad positions without spending more money. This means you can reach more potential customers within your current budget.
Your keyword choices and ad copy effectiveness become clear through CTR analysis. Looking at which ads and keywords have higher CTRs helps you fine-tune your approach.
CTR affects organic search rankings too. Each position you want to move up in Google’s results requires about a 3% increase in organic CTR.
A strong CTR helps reduce your cost-per-click (CPC). Google rewards better Quality Scores with lower costs for the same ad position. This makes your advertising budget work harder.
The foundation of good Google Ads performance starts with understanding how this basic metric shapes your paid search results.
What is a good CTR for Google Ads?
Success with Google Ads begins with understanding what makes a good click-through rate. Let’s learn about the standards that define strong performance in different scenarios.
Average click-through rate by industry
Different industries show varying levels of success with their ads. The latest data shows that the median CTR reached 3.94% across industries by May 2023.
Some industries stand out with exceptional performance:
Travel & Leisure tops the list at 8.87%
Real Estate shows strong results at 7.23%
Education achieves 6.91%
Health Care maintains 6.63%
eCommerce & Marketplaces (1.55%) and Apparel & Footwear (1.69%) see lower CTRs because of intense market competition.
A newer study highlights Dating & Personals (6.05%), Travel & Hospitality (4.68%), and Advocacy (4.41%) as leaders in search CTRs. Your industry’s standard serves as a better gage than general averages.
CTR benchmarks for Search vs Display Network
Search and Display Networks show a clear difference in performance. Google Search Ads typically see CTRs between 3.17% and 6.42%, based on various studies and timeframes. Display Network ads perform at a lower rate of 0.46% to 0.57%.
This difference makes sense because search users actively look for specific information, while display ads try to catch attention from users who focus on other content. A good target for search ad CTRs starts at 2%, though your industry might need different goals.
How ad position affects CTR
Ad placement on search results makes a big difference in performance. Ads in the first position average 7.94% CTR, while second position ads drop to 5.57%.
Studies reveal impressive improvements with better positioning:
CTR jumped 335% when moving from position 8 to 5
Position 1 showed 300% better results than position 5
Top paid spots get 40% more clicks than second-place ads
These numbers show why companies invest more to secure top positions, despite higher costs.
CTR differences by ad format
Ad format choices play a crucial role in performance. Standard text ads set the baseline, but adding extensions can boost engagement.
Extensions add your business details right into Google Ads, making them more informative and noticeable. Local businesses benefit from location extensions that help customers make quick decisions.
Companies should target 4-6% CTRs for search campaigns in 2025, while display campaigns usually stay under 1%. The focus should stay on beating industry averages and showing steady improvement rather than chasing specific numbers.
Note that higher CTRs matter, but they must work together with conversion rates and ROI to deliver real business value. The goal remains generating quality clicks that turn into actual results.
Key factors that influence your CTR
Your Google Ads CTR depends on what makes users click your ads. Several elements determine whether users will click or scroll past your ads.
Ad relevance and keyword targeting
Ad relevance shows how well your ad matches what users are searching for. Google rates relevance as part of Quality Score. They give “Above average,” “Average,” or “Below average” ratings compared to other advertisers who target similar keywords. Your ads will appear to interested prospects when your keywords match user searches exactly. This helps maximize your return on investment. You should also add negative keywords. These prevent wasted impressions on irrelevant searches and help boost your overall CTR.
Headline and description quality
Your ad copy needs to grab attention quickly. Yes, it is important that headlines show clear value, use emotional triggers, and include specific numbers where possible. Words that drive action like “Shop Now,” “Get Started,” or “Claim Your Offer” help get immediate responses. Keywords placed naturally in headlines and descriptions don’t just boost relevance – they also affect Quality Score directly.
Use of ad extensions
Ad extensions give more space to your ads, making them stand out on search results pages. Adding extensions can improve CTR by up to 20%, according to Google. You can use sitelinks to add 4-6 deep links to relevant pages. Price extensions show specific product costs. Location extensions display your business address next to your ad text. These extensions make ads more visible and help improve Quality Score while lowering your cost-per-click.
Landing page alignment
The way your landing page performs affects both CTR and Quality Score. Your page should deliver exactly what the ad promised. The message should stay consistent from ad to landing page. Make sure the page follows through on your ad’s offer or call-to-action. Page speed plays a vital role – even a one-second delay can substantially increase bounce rates, especially on mobile devices.
Audience targeting precision
Good targeting helps your ads reach users who are most likely to click them. Look at Google Analytics and customer data to find your ideal audience based on demographics, behaviors, and interests. Breaking down customers into segments helps send the right message to the right people at the right time. You can find qualified prospects by combining demographics with interest categories.
8 proven ways to improve your Google Ads CTR
Understanding what influences CTR lets you implement strategies that deliver real results. These eight techniques will help you surpass industry standards and maximize your ad performance.
1. Use compelling headlines with offers
Headlines create the first impression, so they must count. Specific offers or discounts in your headlines grab attention instantly. Numbers and statistics perform well in headlines—especially when you have promotions like “Save 25%”. Your unique selling proposition (USP) helps distinguish your brand from competitors.
2. Add strong calls-to-action
Verbs that drive action prompt immediate response. Direct CTAs like “Buy Now,” “Shop Today,” or “Get Started” guide users to convert. Strong verbs such as “Start,” or “Join” create momentum in your CTA. First-person phrases like “Give me my deal” perform better than standard third-person approaches.
3. Include emotional or benefit-driven language
Emotional triggers create more action than logical appeals. Research shows content that makes people angry gets shared 38% more than other types. Show how your offering improves customers’ lives instead of listing features. Language focused on benefits creates stronger connections and gets more clicks.
4. Use ad extensions to increase visibility
Ad extensions expand your ad space and add more information, which can boost CTR by up to 20%. Sitelinks, callouts, and structured snippets should be your basic implementation to boost visibility. Local businesses benefit from location extensions, while call extensions work great for direct phone contact—especially on mobile devices.
5. Match ads to relevant landing pages
Clicks are just the beginning. Your landing page must deliver what your ad promises. This “message match” builds trust and reduces bounce rates. Google recognizes high-converting landing pages as relevant, which can improve Quality Score and lower your cost-per-click.
6. Refine keyword targeting and use negatives
Short and long-tail keywords create balance between reach and precision. Your search terms report needs regular review to spot and fix irrelevant keywords. Detailed negative keyword lists stop wasted impressions on unqualified traffic and increase your overall CTR.
7. A/B test different ad variations
Testing eliminates guesswork and shows what strikes a chord with your audience. Different headlines, descriptions, or CTAs need testing to find combinations that drive the highest CTR. Each element should be tested individually to see what affects performance. You can experiment with multiple campaigns at once using ad variations.
8. Improve Quality Score to boost ad rank
Quality Score affects your ad position and CPC directly. Conversion rates can jump 12% on average when Ad Strength moves from “Poor” to “Excellent”. Ads must stay specific and relevant to each keyword in your ad group. Better positions and lower costs per click come from high-quality ads that Google favors.
How CTR connects to CPC, Quality Score, and ROI
Your Google Ads performance depends on CTR’s role in the bigger picture. These metrics work together like pieces of a puzzle. A change in one metric creates a chain reaction that affects your entire campaign.
What is a good CPC for Google Ads?
The ideal cost-per-click isn’t the same for every industry. CTR plays a key role in determining your CPC – better CTR means you’ll pay less for clicks. Google rewards relevant ads with cheaper placements. Numbers tell the story clearly: top-position ads get about 7.11% CTR while lower positions manage just 0.55%.
How CTR impacts Quality Score
Google rates Quality Score from 1-10 based on how well your ads match what users want. Expected CTR stands out as the vital part of this score. The relationship works like a curve – early CTR improvements give your Quality Score a big boost, but these gains slow down at higher levels.
CTR vs conversion rate: finding the balance
High CTR doesn’t always mean better business outcomes. Lower-CTR ads sometimes bring in more conversions and revenue than their high-CTR counterparts. Adding qualifying statements in your ads might reduce clicks but attract more serious buyers.
Avoiding vanity metrics and focusing on ROI
Looking at CTR alone makes it nothing more than a “vanity metric”. Smart marketers look beyond click rates to measure conversion per impression (CPI) or revenue per impression (RPI). The ROI formula—(Revenue – Cost)/Cost—shows the real story of your campaign’s success. This helps you focus on growing your business instead of just collecting clicks.
Conclusion
Good CTR metrics for Google Ads go beyond simple industry averages. The standard rates hover between 7-9% for search ads and stay below 1% for display ads. Your industry plays a crucial role in these numbers. Companies in travel, real estate, and education sectors tend to see better results than those in eCommerce and apparel.
The smart approach is to focus on beating your industry’s average CTR instead of chasing general standards. Ad placement makes a big difference in performance. Top positions get CTRs that are almost 300% higher than lower spots. This explains why paying more for premium positions often makes good business sense.
Your CTR has a direct effect on Quality Score, which then shapes your ad costs and positions. Google’s algorithms view higher CTRs as a sign of relevance. This can lead to lower cost-per-click and better visibility for your ads.
CTR works best when considered with other metrics. High click rates combined with poor conversion numbers just waste your budget on the wrong traffic. The best strategy is to create ad copy that brings in qualified visitors.
You can boost your performance with eight proven strategies. Write compelling headlines that include strong calls-to-action and highlight benefits. Use every available ad extension, fine-tune your keyword targeting, and make sure your ads match your landing pages perfectly.
Regular A/B testing helps you find what strikes a chord with your audience. Simple tweaks to your copy can lead to big CTR improvements across your campaigns.
Success in Google Ads comes from seeing CTR as one piece of the performance puzzle. By optimizing click rates along with conversion metrics and ROI calculations, you can turn Google Ads from a cost center into a reliable revenue stream for your business.
FAQs
Q1. What is considered a good click-through rate (CTR) for Google Ads? A good CTR for Google Ads typically ranges from 7% to 9%, but this can vary significantly by industry. For search ads, aim for 4-6%, while display ads usually perform below 1%.
Q2. How does ad position affect click-through rate? Ad position significantly impacts CTR. Ads in the top position can achieve CTRs as high as 7.11%, compared to just 0.55% for ads in lower positions. Moving from position 8 to position 5 can result in a 335% CTR increase.
Q3. What are some effective ways to improve Google Ads CTR? To improve CTR, use compelling headlines with specific offers, add strong calls-to-action, include emotional or benefit-driven language, utilize ad extensions, match ads to relevant landing pages, refine keyword targeting, and conduct A/B testing on ad variations.
Q4. How does CTR impact Quality Score and cost-per-click (CPC)? CTR directly influences Quality Score, which in turn affects ad position and CPC. Higher CTRs generally lead to better Quality Scores, potentially resulting in lower costs per click and improved ad positions.
Q5. Should I focus solely on improving CTR for my Google Ads campaigns? While CTR is important, it shouldn’t be the only focus. Balance CTR with other metrics like conversion rate and return on investment (ROI). Sometimes, lower-CTR ads can outperform high-CTR ads in total conversions and revenue, so consider metrics like conversion per impression (CPI) or revenue per impression (RPI) for a more comprehensive view of campaign effectiveness.
Negative keywords prevent your ads from showing when users search for terms that won’t convert. They’re the most direct way to stop wasting ad spend on irrelevant clicks — and the most commonly underused optimization lever in Google Ads.
The mechanics are straightforward: you add a word or phrase as a negative keyword, and Google blocks your ad from appearing in searches that include that term. But how Google interprets “include” depends entirely on which negative match type you choose — broad, phrase, or exact — and each type blocks traffic differently.
There’s one critical distinction that trips up most advertisers: negative keywords do not match close variants, synonyms, plurals, or misspellings. This is the opposite of how positive keywords work. If you add “running shoes” as a negative keyword, your ad can still show for “running shoe” (singular), “run shoes,” or “jogging sneakers.” You have to add each variation separately. This single difference is responsible for most negative keyword strategy failures.
How the Three Negative Match Types Work
Negative Broad Match
The default type. No special formatting — just type the keyword. Your ad is blocked when the search contains all of your negative keyword terms, in any order. If a search is missing even one term, your ad can still show.
Negative keyword: running shoes
Search Query
Ad Shows?
Why
blue running shoes
Blocked
Contains both “running” and “shoes”
running shoes sale
Blocked
Contains both terms
shoes running cheap
Blocked
Both terms present, order irrelevant
running gear
Shows
Missing “shoes”
running shoe
Shows
“Shoe” (singular) is not “shoes” — no close variant matching
jogging sneakers
Shows
Different words entirely — no synonym matching
Negative broad match casts the widest net of the three types. It’s the right choice for general exclusions where you want to block a concept across many query variations: “free,” “jobs,” “DIY,” “how to,” “salary.”
Negative Phrase Match
Formatted with quotation marks: “running shoes”. Your ad is blocked when the search contains your negative keyword terms in the exact order you specified. Additional words can appear before or after the phrase, but the phrase itself must be intact.
Negative keyword: “running shoes”
Search Query
Ad Shows?
Why
best running shoes
Blocked
Phrase appears in order, extra word before
running shoes for women
Blocked
Phrase appears in order, extra words after
shoes for running
Shows
Words are present but in different order
running athletic shoes
Shows
“Athletic” breaks the phrase sequence
Negative phrase match is the best choice when you need to block a specific intent without accidentally blocking queries where those words appear in a different context. “Running shoes” as a phrase negative blocks all running shoe queries while still allowing “shoes for running trails” (where the intent might be different).
Negative Exact Match
Formatted with square brackets: [running shoes]. Your ad is blocked only when the search matches your negative keyword exactly — same words, same order, no additional words.
Negative keyword: [running shoes]
Search Query
Ad Shows?
Why
running shoes
Blocked
Exact match
best running shoes
Shows
Extra word present
running shoes sale
Shows
Extra word present
running shoe
Shows
Singular, not matched
Negative exact match is the most precise and least restrictive type. Use it when you need to block one specific query without any risk of blocking related queries that might convert. This is the safest option but requires the most keywords to achieve comprehensive coverage.
The Close Variant Rule: Why Most Negative Strategies Fail
This point is worth repeating because it causes the majority of negative keyword problems: negative keywords do not expand to close variants.
With positive keywords, Google automatically matches your keyword to plurals, misspellings, synonyms, abbreviations, and reworded versions with the same intent. Adding “running shoes” as a positive broad match keyword matches queries like “running shoe,” “jogging sneakers,” “athletic running footwear,” and dozens of other variations.
Negative keywords don’t do this. If you add “running shoes” as a negative, Google blocks exactly the word “running” and the word “shoes” (in the match type behavior you selected). It does not block “running shoe” (singular), “jogging shoes” (synonym), “running sneakers” (related term), or “runnning shoes” (misspelling). Each of these must be added as a separate negative keyword if you want them blocked.
This means comprehensive negative keyword coverage requires you to add every variation manually: singular and plural forms, common misspellings, synonyms, and abbreviations. For high-impact exclusions, build a list that covers all variations rather than assuming one entry will catch everything.
Apply across every campaign in your account. Use this for terms that are universally irrelevant to your business — “free,” “jobs,” “careers,” “salary,” “internship,” “login,” “password reset.” These terms should never trigger your ads regardless of campaign or product line.
Account-level negatives are managed through the account-level keyword settings. You can add up to 1,000 account-level negative keywords.
Campaign-Level Negative Keywords
Apply across all ad groups within a specific campaign. Use this for terms that are irrelevant to that campaign’s products or services but might be relevant in other campaigns. A campaign selling formal shoes might have “athletic,” “running,” and “hiking” as campaign-level negatives, while a separate campaign selling athletic shoes would not.
Ad Group-Level Negative Keywords
Apply only to a specific ad group. Use this for precise traffic routing between ad groups within the same campaign. If you have separate ad groups for “men’s running shoes” and “women’s running shoes,” you might add “women’s” as a negative in the men’s ad group and “men’s” as a negative in the women’s ad group to prevent overlap.
Negative Keyword Lists (Shared Libraries)
Shared negative keyword lists let you create a single list and apply it across multiple campaigns. This is the most efficient way to manage universal exclusions. You can create up to 20 lists per account, with up to 5,000 keywords per list.
Create lists in Google Ads under Tools & Settings > Shared Library > Negative keyword lists. Name them descriptively: “Universal Exclusions,” “Job Seeker Terms,” “Competitor Brand Names,” “Informational Intent.”
Negative Keywords in Performance Max
Google now supports campaign-level negative keywords in Performance Max campaigns — up to 10,000 per campaign. This was one of the most requested features since PMax launched and represents a major improvement in advertiser control over PMax traffic quality.
PMax negatives apply to both Search and Shopping inventory within the campaign. Add negatives through the campaign settings under “Additional settings” > “Negative keywords.” For PMax campaigns running ecommerce traffic, this is critical for filtering out informational queries, competitor terms, and job-seeker traffic that waste budget without converting.
The Search Term Report Mining Process
Negative keyword optimization is an ongoing process, not a one-time setup. The Search Terms report is where you find the queries that are actually triggering your ads — and where you identify the ones that shouldn’t be.
The Weekly Review Workflow
Step 1: Pull the report. In Google Ads, go to Insights and Reports > Search terms. Filter by the last 7-14 days.
Step 2: Sort by cost (highest first). The queries spending the most money without converting are your highest-priority negative keyword candidates.
Step 3: Identify irrelevant queries. Look for searches that triggered your ad but clearly don’t match your product or service. Common patterns: job-seeker queries, informational/educational queries, queries for products you don’t sell, queries mentioning competitors you don’t want to compete against.
Step 4: Decide the match type. If the irrelevant term is a single word that’s always irrelevant (“jobs,” “free”), add it as a negative broad match. If it’s a specific phrase where the word order matters (“how to build,” “DIY repair”), use negative phrase match. If it’s one specific query you want to block without affecting similar queries, use negative exact match.
Step 5: Add the negative and its variations. Remember: no close variant matching. Add the singular, the plural, and any common synonyms as separate entries.
Step 6: Log the addition. Keep a running record of what you added, when, and why. This prevents accidentally removing negatives later and helps you audit your lists periodically.
The Quarterly Audit
Every quarter, review your complete negative keyword lists for terms that may no longer be relevant (your product line expanded, a previously irrelevant category is now something you sell), terms that are too broad and might be blocking relevant traffic (check impression volume trends — a sudden drop after adding negatives may indicate overblocking), and gaps where new irrelevant query patterns have emerged.
Starter Negative Keyword Lists by Business Type
These lists cover the most common irrelevant query patterns. Customize them for your specific business.
Universal (All Businesses)
free, jobs, careers, career, salary, salaries, employment, hiring, internship, intern, volunteer, training, certification, course, class, tutorial, definition, wiki, Wikipedia, Reddit, Quora, PDF, download free, template free, DIY, do it yourself, how to make, how to build
free trial (if you don’t offer one), open source, free alternative, cheap, cheapest, vs (add only for competitors you don’t want to compare against), integration (for platforms you don’t integrate with), API documentation (if targeting buyers, not developers)
Local Services
DIY, how to, tutorial, near me (for locations you don’t serve — add specific city/region names), cost to (if you want to avoid price-shopping queries), average cost, cheap, cheapest, training, school, license, exam
Professional Services (Legal, Medical, Financial)
free consultation (if you don’t offer one), pro bono, legal aid, malpractice, complaint, board complaint, salary, school, degree, certification, exam
Common Mistakes to Avoid
Over-Negating
Adding too many negatives, or negatives that are too broad, silently kills your impression volume. A classic mistake: adding a single word as a broad match negative when that word appears in many relevant queries. Adding “blue” as a broad match negative because you don’t sell blue products will also block “blue chip companies” if you’re a financial services firm.
Check impression trends after adding negatives. A sudden drop suggests you’ve blocked relevant traffic.
Not Adding Variations
Because negative keywords don’t match close variants, adding “shoe” doesn’t block “shoes.” Adding “plumber” doesn’t block “plumbing” or “plumbers.” Every variation needs its own entry. For high-impact negatives, build a complete variation list: singular, plural, gerund (-ing), past tense (-ed), common misspellings.
Using Campaign-Level When Ad Group-Level Is Needed
A campaign-level negative blocks the term across every ad group. If you sell both “running shoes” and “running gear,” adding “gear” as a campaign-level negative to protect your shoe ad group also blocks it from your gear ad group. Use ad group-level negatives for traffic routing within a campaign.
Never Reviewing the Impact
After adding negatives, monitor the affected campaigns for 7-14 days. Check whether impressions dropped more than expected, whether CTR and conversion rate improved (the intended outcome), and whether any high-performing queries were accidentally blocked.
Forgetting About PMax
If you run Performance Max alongside Search campaigns, your Search campaign negatives don’t automatically apply to PMax. Add critical negatives to your PMax campaigns separately.
Bulk Management with Google Ads Editor
For accounts with extensive negative keyword needs, Google Ads Editor (a free desktop application) is significantly faster than the web interface. You can export your entire account’s negative keyword structure, edit in bulk using spreadsheet-like functionality, import negative keyword lists from CSV files, and copy negative keywords between campaigns and ad groups.
This is particularly useful when setting up a new account or performing a quarterly negative keyword audit across many campaigns simultaneously.
Frequently Asked Questions
What’s the most important thing to know about negative keyword match types?
That they don’t match close variants. This is the single biggest difference from positive keywords and the most common source of negative keyword failures. Adding “running shoes” as a negative does not block “running shoe” (singular), “jogging shoes” (synonym), or “run shoes” (variation). You must add each form separately. Every other negative keyword decision follows from understanding this fundamental behavior.
Which negative match type should I use most often?
For most advertisers, negative broad match is the workhorse. It blocks queries containing all your negative terms in any order, which efficiently covers the widest range of irrelevant searches with a single entry. Use negative phrase match when word order matters to the meaning. Use negative exact match when you need surgical precision on a specific query without risking overblocking.
Can I use negative keywords in Performance Max campaigns?
Yes. Google now supports up to 10,000 campaign-level negative keywords per PMax campaign. Add them through campaign settings under “Additional settings.” This is critical for PMax campaigns because without negatives, PMax’s broad targeting frequently triggers ads for informational queries, job-seeker terms, and other non-converting traffic that waste budget.
How many negative keywords should I have?
There’s no target number — it depends on your industry, the match types of your positive keywords, and how much irrelevant traffic your campaigns attract. Accounts using broad match positive keywords typically need more negatives than accounts using only exact match. A well-maintained account might have 100-500 negative keywords across shared lists and campaign-level settings. The right number is whatever it takes to filter irrelevant traffic without blocking relevant queries.
How often should I review and update negative keywords?
Weekly reviews of the Search Terms report are the minimum for active campaigns. Each review typically surfaces 5-15 new negative keyword candidates. Quarterly audits of your complete negative keyword lists catch overblocking issues and gaps. Campaigns using broad match positive keywords need more frequent negative keyword attention than campaigns using only exact match.
Can negative keywords hurt my campaign performance?
Yes, if you over-negate. Adding too many broad match negatives, or negatives that contain words present in relevant queries, can suppress your impression volume and prevent your ads from reaching qualified prospects. Always monitor impression trends after adding negatives. If impressions drop significantly without a corresponding improvement in CTR and conversion rate, you may have blocked relevant traffic. Use negative exact match instead of broad match when the risk of overblocking is high.
The average cost per click on Facebook ads is roughly $0.83-$1.72 across all industries, with CPM (cost per thousand impressions) sitting around $11-$17. But these aggregate numbers are nearly useless for planning. A legal services advertiser paying $4.45 per click and a food brand paying $0.45 per click are both “on Facebook,” and neither benefits from knowing the other’s average.
What actually determines your Facebook ad costs is the intersection of your industry, campaign objective, audience targeting, creative quality, placement mix, geographic market, and time of year. This guide breaks down each variable with current benchmark data from multiple sources, provides the budget formulas that connect cost metrics to business outcomes, and covers the optimization levers that reduce costs without reducing results.
The Cost Metrics That Matter (and How to Read Them)
CPC (Cost Per Click)
CPC measures what you pay each time someone clicks your ad. The platform-wide average hovers around $0.83-$1.14 for link clicks, but the range by industry spans from $0.45 (apparel) to $3.77 (finance and insurance).
CPC alone tells you almost nothing about campaign health. A $3.77 CPC in finance that converts at 8% and generates a customer worth $5,000 in lifetime value is dramatically more profitable than a $0.45 CPC in apparel that converts at 0.3% and generates a $35 average order. Always evaluate CPC relative to your conversion rate and customer value.
CPC also varies significantly by campaign objective. Traffic campaigns average approximately $0.70 per click. Lead generation campaigns average $1.92. Conversion-optimized campaigns typically fall between $1.00 and $2.50 depending on the conversion action and industry.
CPM (Cost Per Thousand Impressions)
CPM measures how much you pay to have your ad shown 1,000 times. It reflects auction competitiveness for your target audience. The blended average across industries sits around $11-$17, with substantial variation by vertical: beauty and health averages $12-$13, hardware and automotive around $7, finance and insurance $18-$28, entertainment around $5, and ecommerce blended around $10-$17 depending on the data source.
CPM differences between data sources are normal and expected. One benchmark measuring mostly Feed placements will report different CPMs than one measuring broad Advantage+ delivery across Reels, Stories, and Audience Network. Meta’s own documentation confirms this: the delivery system optimizes for lowest average cost overall, not lowest cost per individual placement.
CPA (Cost Per Action / Acquisition)
CPA is the metric that connects ad spend to business outcomes. The median CPA across all industries is approximately $18-$38 depending on the data source and campaign mix. Industry-level CPA ranges from roughly $7-$8 (fitness, food) to $55+ (technology, financial services).
CPA is the number your CFO cares about. Track it, benchmark it against your profit margins, and use it as the primary metric for budget allocation decisions.
ROAS (Return on Ad Spend)
ROAS measures revenue generated per dollar of ad spend. The median ROAS across industries is approximately 1.93x, meaning for every $1 spent, advertisers generate $1.93 in revenue. Industries with high AOV and repeat purchase behavior (beauty, food and beverage, health) tend to report higher ROAS.
ROAS below 1.0x means you’re spending more on ads than you’re generating in revenue (before accounting for product costs and overhead). For most ecommerce businesses, break-even ROAS is 2.0-3.0x depending on margins. For lead generation businesses, ROAS needs to be calculated against customer lifetime value, not just first-purchase value.
Why Costs Vary: The Seven Variables
1. Industry
Your industry is the single largest determinant of Facebook ad costs. Finance, insurance, and legal services consistently pay the highest CPCs and CPMs because of high customer lifetime values and intense competition. Apparel, food, and entertainment pay the lowest.
This variance isn’t random — it reflects the economics of each industry. Advertisers in high-LTV industries can afford to pay more per click because each conversion is worth more. The auction system adjusts accordingly.
2. Campaign Objective
The objective you select tells Facebook what to optimize for, which directly determines your audience’s value in the auction.
Awareness and reach campaigns produce the lowest CPMs ($3-$8) because Facebook is optimizing for the cheapest impressions among your target audience. Traffic campaigns produce moderate CPCs ($0.50-$1.00) because Facebook is finding people likely to click. Conversion campaigns produce the highest CPAs because Facebook is targeting people likely to take a specific action — and those people are the most competed-for audience on the platform.
This cost hierarchy is structural, not a bug. Getting someone to see your ad costs less than getting them to click, which costs less than getting them to buy.
3. Audience Targeting
Broader audiences generally produce lower CPMs. Narrow audiences — specific age ranges, interests, behaviors, custom audiences — produce higher CPMs because more advertisers are competing for those same high-value segments.
The counterintuitive finding: broader audiences with Advantage+ targeting often produce lower CPAs than narrow manual targeting, because Facebook’s algorithm finds converting users more efficiently than manual audience selection. This works best when you have sufficient conversion data (50+ conversions per week per ad set) for the algorithm to learn from.
4. Creative Quality
Facebook’s auction system calculates “total value” as a combination of your bid, estimated action rate, and ad quality. Higher-quality ads (measured by engagement rate, click-through rate, and user feedback) can win auctions at lower bids. Low-quality ads can cost 20-50% more than average for the same placements.
Creative quality is the most controllable cost lever in your entire campaign. Better creative doesn’t just improve results — it directly reduces what you pay for each result.
5. Placement
Where your ad appears within Meta’s ecosystem dramatically affects CPM. Feed placements (Facebook and Instagram) are typically the most expensive because they have the highest engagement. Right column placements on desktop are cheapest but have the lowest CTR. Stories and Reels offer a middle ground.
Reels placements currently offer a 30-40% CPM discount compared to Feed placements. This makes Reels one of the most cost-efficient inventory sources on Meta right now. Advantage+ placements, which let Meta distribute your budget across all available surfaces, typically reduce cost per action by 10-20% compared to manual placement selection.
6. Geographic Market
Country-level CPM differences are enormous. US CPMs average $16-$23. UK averages $11-$12. India averages $1-$2. English-speaking, high-income markets attract the most advertiser competition, which drives up costs across the board.
Within a single country, urban areas and affluent zip codes command premium CPMs because more advertisers target those populations. A campaign targeting Manhattan will cost significantly more than the same campaign targeting rural Ohio.
7. Seasonality
Q4 (November-December) is the most expensive period on Facebook. CPMs typically rise 15-40% above the annual average as ecommerce, retail, travel, and brand advertisers flood the auction ahead of Black Friday, Cyber Monday, and the holiday season. CPCs follow the same pattern.
Q1 (January-February) is consistently the cheapest period. Many advertisers reduce spending after the holidays, creating less auction competition and lower costs. This is the optimal time to test new audiences, creative concepts, and campaign structures at reduced cost.
The cost swing between Q1 and Q4 can be 40-60%, which means annual budget planning must account for seasonal pricing or risk running out of budget during peak periods.
Prospecting vs. Retargeting: Different Cost Profiles
Blending prospecting and retargeting costs into a single average misrepresents both. These are fundamentally different campaign types with different cost structures.
Prospecting campaigns (reaching new audiences who haven’t interacted with your brand) have higher CPMs, lower CTRs, and lower conversion rates. They cost more per acquisition but generate new customers.
Retargeting campaigns (reaching people who’ve visited your website, engaged with your content, or are on your customer list) have lower CPMs, higher CTRs, and significantly higher conversion rates. They produce conversions at 20-50% lower CPA than prospecting.
The mistake many advertisers make is over-investing in retargeting because the CPA looks better. Retargeting only works when you have a pool of prospects to retarget — and that pool comes from prospecting. Most successful Facebook ad programs allocate 60-70% of budget to prospecting and 30-40% to retargeting. Over-indexing on retargeting leads to audience exhaustion, rising frequency, and declining returns.
Budget Planning: The Math That Matters
The 50-Conversion Rule
Facebook’s delivery algorithm needs approximately 50 conversion events per week per ad set to exit the learning phase and optimize effectively. This creates a minimum budget floor tied to your CPA.
Formula: Minimum daily budget per ad set = (Target CPA x 50) / 7
If your target CPA is $20: ($20 x 50) / 7 = $143/day per ad set. If your target CPA is $50: ($50 x 50) / 7 = $357/day per ad set.
Running three ad sets at $143/day ($429 total) produces better results than ten ad sets at $43/day ($430 total) because the consolidated ad sets accumulate conversion data faster and exit the learning phase sooner.
Budget Allocation by Funnel Stage
For new accounts building from scratch, a common framework is 60% awareness/prospecting, 25% consideration/engagement, and 15% conversion/retargeting. As your retargeting pools grow and conversion data accumulates, shift toward 40% prospecting, 30% consideration, and 30% conversion.
These ratios aren’t universal. Businesses with strong brand recognition and large website traffic can allocate more to conversion campaigns immediately. New brands with no audience need to invest more heavily in prospecting to build their funnel.
Scaling Without Breaking Performance
Increase budgets by no more than 20% every 3-4 days. Larger increases risk resetting the learning phase and causing performance instability. Advantage+ campaign budget (formerly CBO) allows more aggressive scaling because it distributes budget across ad sets dynamically. With ASC, you can roughly double weekly until profitability degrades.
Monitor ad frequency and “First Time Impression Ratio” as you scale. When the ratio drops below 30%, you’re reaching the same people repeatedly rather than finding new ones. That’s the signal to expand targeting or test new audiences rather than increasing budget on current ones.
How to Reduce Facebook Ad Costs
Improve Creative Quality
The highest-leverage cost reduction lever. Better ads get higher engagement, which improves your estimated action rate, which reduces your cost in the auction. Video ads typically generate higher engagement than static images. User-generated content style creative often outperforms polished production creative. Testing multiple creative variations per ad set lets Facebook optimize toward the best performers automatically.
Rotate creative every 2-4 weeks to prevent fatigue. When frequency exceeds 2.5-3.0 for the same creative, performance degrades and costs rise. Facebook’s “Creative Limited” and “Creative Fatigue” warnings in Ads Manager indicate when rotation is needed.
Use Advantage+ Placements
Let Meta distribute your budget across all available placements instead of manually selecting Feed only. Advantage+ placements reduce CPA by 10-20% on average because they find cost-efficient impressions across Reels, Stories, Audience Network, and other surfaces that manual selection would miss.
Leverage Reels
Reels inventory is currently underpriced relative to Feed — 30-40% lower CPMs. Creative designed for Reels (vertical, fast-paced, authentic-feeling, 15-30 seconds) can capture attention at a significant cost advantage. This pricing gap won’t last forever as more advertisers shift budget to Reels, so the window for below-market CPMs is now.
Advantage+ Shopping Campaigns (ASC)
For ecommerce advertisers, ASC is consistently the most cost-efficient campaign type on Meta. It uses machine learning to optimize creative, audience, and placement simultaneously. Advertisers report 15-25% lower CPAs compared to manually structured campaigns. ASC works best with a broad catalog and strong creative variety.
Exclude Low-Value Audiences
Remove audiences that click but don’t convert: existing customers (unless you’re running retention campaigns), users who’ve already converted on your current offer, audiences with demonstrated low purchase intent, and geographic regions that don’t convert. A/B tests show that strategic audience exclusions reduce median CPA by approximately 20%.
A/B Test Systematically
Test one variable at a time: creative, audience, placement, or objective. Ensure each variation receives enough budget to generate at least 50 conversions for statistical significance. Use the winning variants to replace underperformers, then test the next variable. Continuous testing produces compounding efficiency gains over time.
The Auction System: Why Quality Beats Budget
Facebook doesn’t award ad placements to the highest bidder. It calculates “Total Value” for each ad entering the auction:
Total Value = (Advertiser Bid x Estimated Action Rate) + Ad Quality
An ad with a lower bid but higher quality and action rate can win the auction over a higher-bidding competitor with worse creative. This means smaller advertisers with better creative can compete effectively against larger budgets.
Facebook uses this system because showing users ads they don’t like drives them off the platform, which reduces future ad inventory. By rewarding quality, Facebook maximizes long-term revenue while giving users a better experience.
The practical implication: investing in creative quality, landing page experience, and audience relevance reduces your costs more reliably than increasing your bid. Quality is a cost lever, not just a performance lever.
Frequently Asked Questions
How much should I budget for Facebook ads as a beginner?
Start with enough to exit the learning phase: at minimum $50/day per campaign, ideally calculated using the 50-conversion rule (Target CPA x 50 / 7 = minimum daily budget per ad set). Running one campaign with adequate budget produces better results than spreading a small budget across multiple campaigns. Begin with a conversion campaign targeting your highest-value action, and scale based on results after the first 2-3 weeks of data.
Are Facebook ads getting more expensive?
CPMs have risen approximately 20% year-over-year according to Triple Whale’s benchmark data, driven by increased competition and broader Advantage+ adoption. However, CPA trends are mixed — many industries see stable or improving CPAs because better AI optimization, creative testing, and Advantage+ campaigns offset rising impression costs. The cost per impression is rising; the cost per result depends on how well you optimize.
What’s the cheapest campaign objective?
Awareness and reach campaigns produce the lowest CPMs ($3-$8 per thousand impressions). Traffic campaigns produce the lowest CPCs ($0.50-$0.70). But “cheapest” and “most efficient” aren’t the same thing. Conversion campaigns cost more per click but produce actual business outcomes. Optimize for the metric that drives revenue, not the metric that looks best in a report.
How do I reduce Facebook ad costs without reducing performance?
Focus on creative quality (the single highest-leverage lever), use Advantage+ placements (10-20% CPA reduction), leverage Reels inventory (30-40% CPM discount), exclude low-value audiences (20% CPA reduction from strategic exclusions), and rotate creative before fatigue sets in (replace creative when frequency exceeds 2.5-3.0). These optimizations compound — applying all of them can reduce costs by 30-50% without sacrificing conversion volume.
Should I use manual or automated bidding?
Automated bidding (Maximize Conversions or Target CPA) outperforms manual bidding for most advertisers. Data shows automated bidding produces roughly 15% lower CPCs and 20% more conversions than manual approaches. Manual bidding is useful only when you have specific cost caps that can’t be exceeded — and even then, you risk under-delivering if your cap is too aggressive. Start with automated, and only switch to manual for specific cost-control scenarios.
How do seasonal trends affect my budget planning?
Q4 CPMs rise 15-40% above annual averages due to holiday competition. Q1 offers the lowest costs as advertisers pull back. Plan your annual budget with seasonal weighting: allocate more budget to Q1 (when costs are low and testing is cheap) and Q3 (pre-holiday audience building), and ensure Q4 budget accounts for the premium pricing. For businesses that don’t sell seasonal products, Q1 and Q2 offer the best cost-per-acquisition environment of the year.
Tupa helps international e-commerce and B2B companies grow profitably through data-driven Google Ads and SEO – with the execution speed of a China-based team and the transparency you expect from a Western agency.
Tupa is a certified partner in Google Ads
Kiara Foster
Head of Content
Kiara
Edit this chat template from WP Admin > Templates > Floating Elements